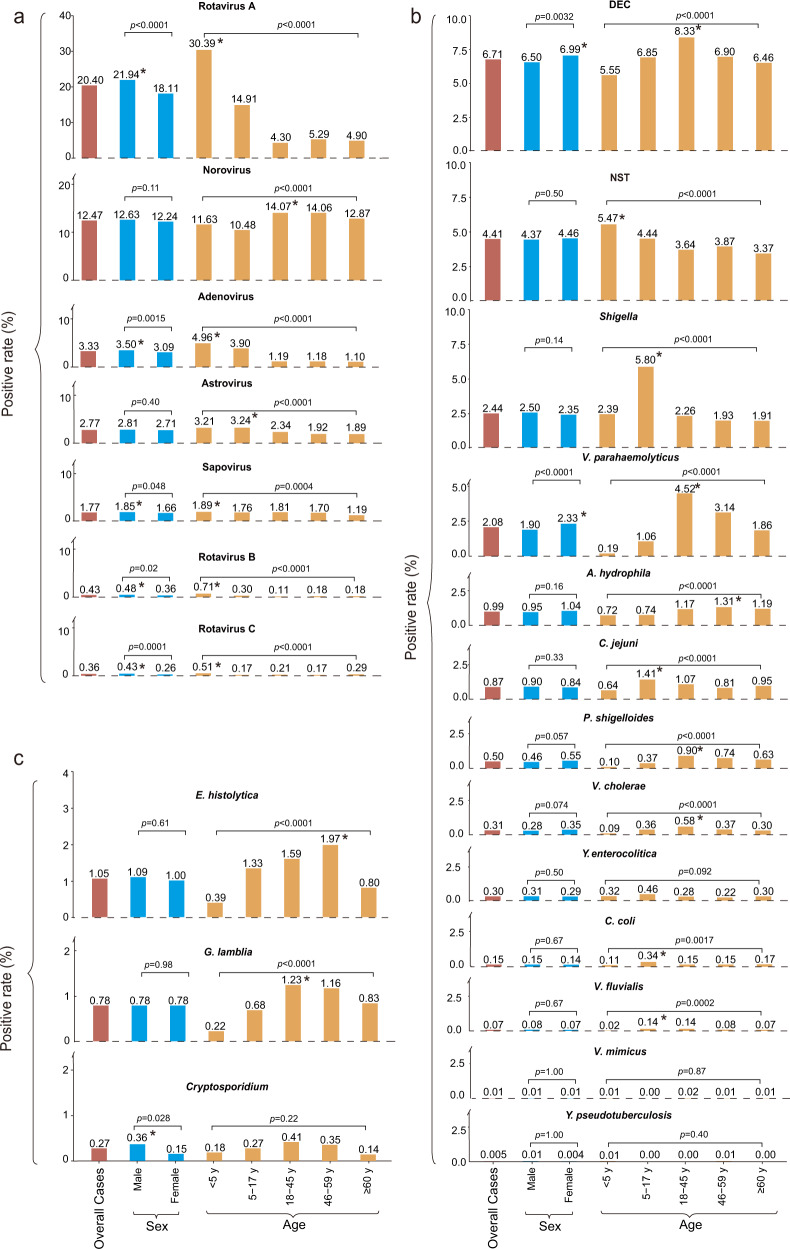
Fig. 3. Positive rate of pathogens by sex and age in patients with diarrhea in China, 2009‒2018.
a Viral pathogens. b Bacterial pathogens. c Parasite pathogens. The lengths of red bars indicate the positive rate of each pathogen. The lengths of blue bars and yellow bars indicate the positive rate of each pathogen by sex and age groups. The same group was marked by the same colors of bars filling. *Indicates a significant difference (chi-square test or Fisher’s exact test were two-sided and p < 0.05 was statistically significant) found within the group. DEC diarrheagenic Escherichia coli; NTS nontyphoidal Salmonella. Source data are provided as a Source Data file.

