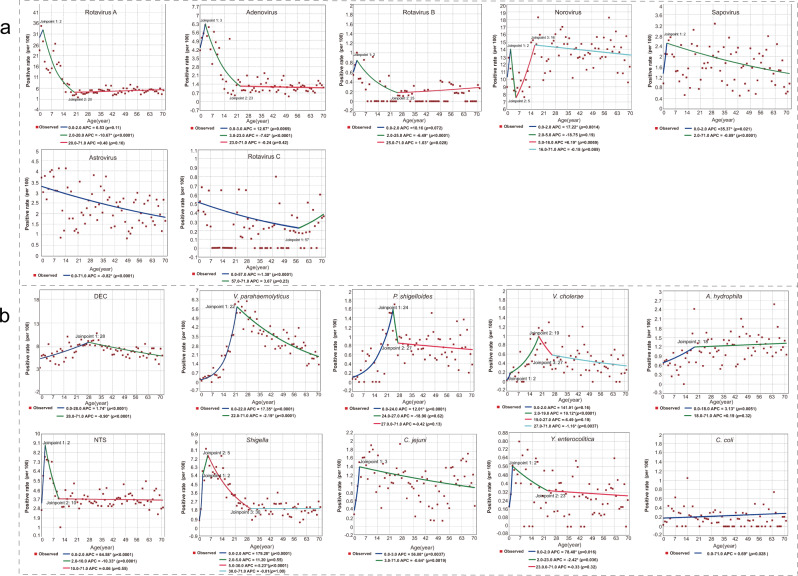
Fig. 4. The joinpoint regression of the positive rates of each enteropathogen by age of the patient.
a Viral pathogens. b Bacterial pathogens. A red point indicates the positive rate of patients in terms of age and the colored curves indicate fitted patterns by the red points. Legends give the annual percentage change (APC) value of each fitted curve for each enteropathogen. *Indicates that the APC is significantly different from zero at p < 0.05. A normal (Z) distribution was used to assess the significance of the APC. All statistical tests were two-sided and p < 0.05 was statistically significant. DEC diarrheagenic Escherichia coli; NTS nontyphoidal Salmonella. Source data are provided as a Source Data file.

