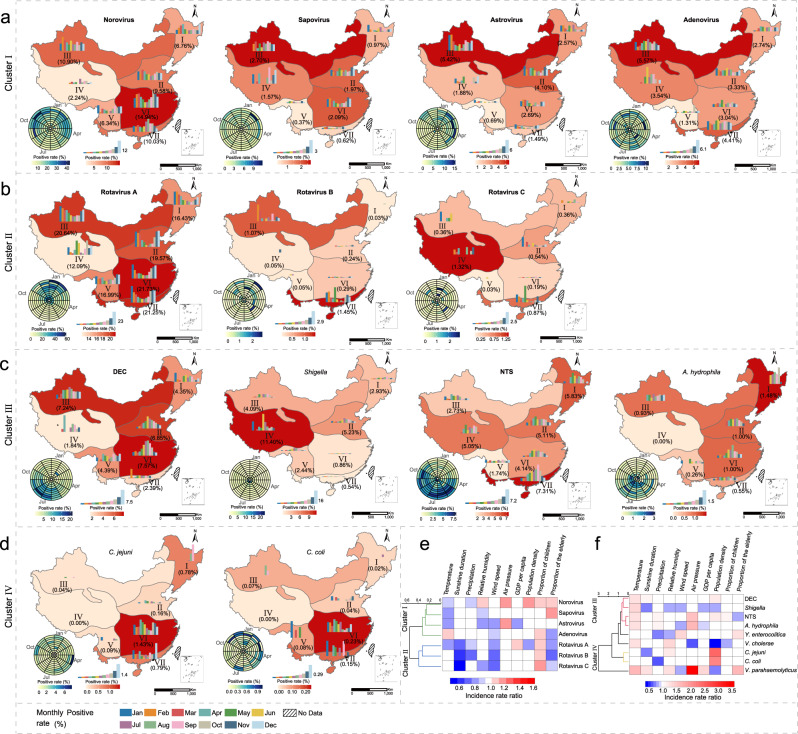
Fig. 5. Spatial and temporal pattern of four clusters of enteropathogens in patients with diarrhea in the mainland of China during 2009‒2018.
Thirteen of the tested enteropathogens were formed into four clusters (a‒d). The seasonality was presented with a radar diagram based on the monthly positive rate from 2009 to 2018. The circumference is divided into 12 months in a clockwise direction, and the radius from inside to outside represents a particular year from 2009 to 2018. Seven ecological regions were marked (I, Northeast China district; II, North China district; III, Inner Mongolia-Xinjiang district; IV, Qinghai-Tibet district; V, Southwest China district; VI, Central China district; VII, South China district). Within each ecological region, the positive rate was noted and reflected by the background color. Histograms within each ecological region indicate the monthly positive rate averaged from 10-year data. The height of the bars indicates the positive rate of each month. *No sample in the month. The dendrogram in e, f display the clusters I‒IV. Green lines mean cluster I. Blue lines mean cluster II. Red lines mean cluster III. Yellow lines mean cluster IV. The incidence rate ratio, ranging from negative influence (blue) to positive influence (red). The features used for clustering are variables with statistically significant differences in the negative binomial model. DEC diarrheagenic Escherichia coli; NTS nontyphoidal Salmonella. Source data are provided as a Source Data file.

