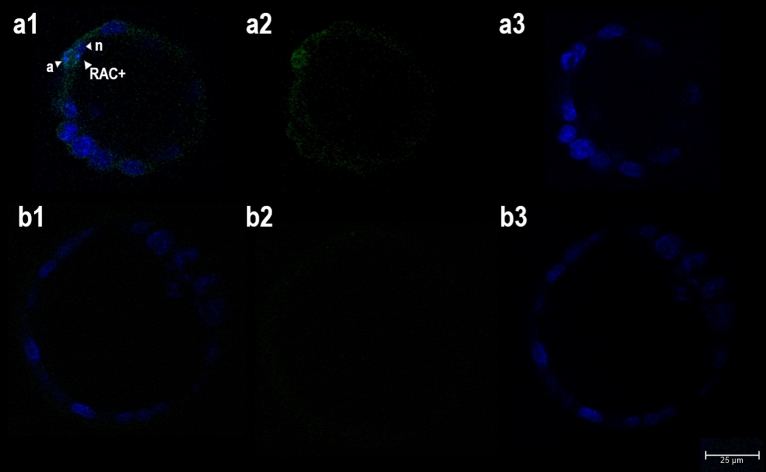
Figure 4.
Analysis of phagosome formation in mouse blastocysts. Images were obtained by confocal laser scanning microscopy (magnification × 400). Single optical sections of two blastocysts are shown in the pictures (a,b). (a) Immunochemical staining of RAC1 (a2, green) combined with Hoechst 33342 DNA staining (a3, blue) (a1: merge). (b) Negative control staining (b2, omission of primary antibody) combined with Hoechst 33342 DNA staining (b3, blue) (b1: merge). (a1) presence of RAC1 (RAC +) in a membrane-like formation surrounding one nucleus with a condensed morphology (a) next to nucleus with normal morphology (n).

