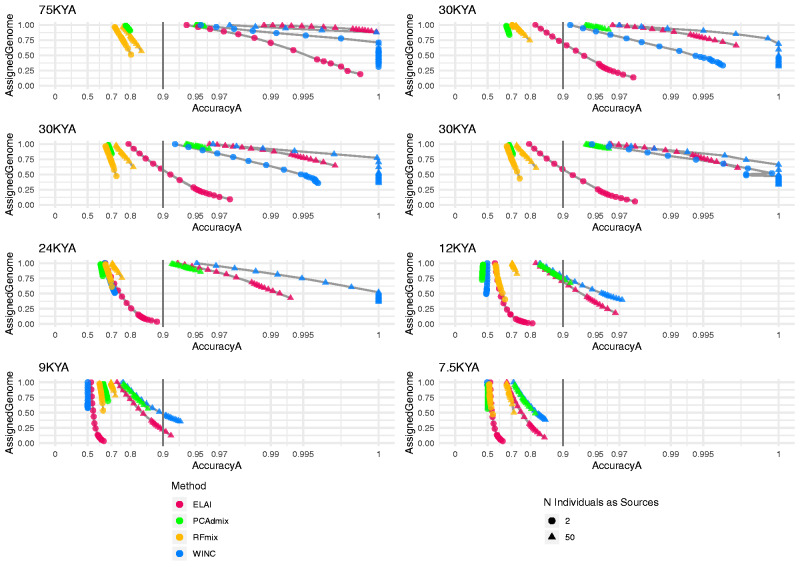
Fig. 2.
WINC performance on the Test Set compared with several Local Ancestry tools: ELAI, PCAdmix, and RFmix. The eight panels represent results for different admixed populations with different divergence times. Within each series, different data points linked by a gray line represent experiments run using increasingly stringent AS thresholds, and for which a nonzero amount of genomes was assigned to at least one ancestry by that particular LAI method. x axis shows accuracy(a) values, y axis shows the proportion of genome windows retrieved. Red points indicate the results obtained using ELAI, green dots indicate PCAdmix results, orange dots list RFmix results, whereas blue points list WINC results. Triangles indicate Local Ancestry results using 50 individuals per source, whereas dots list results using two individuals. We note that in the “12 ka” panel, when two individuals are used as reference, both PCAdmix and WINC accuracy values decrease with increasingly stringent AS thresholds. This effect is however minor (PCAdmix accuracy values range from 0.44 to 0.43 and WINC values range from 0.51 to 0.49).

