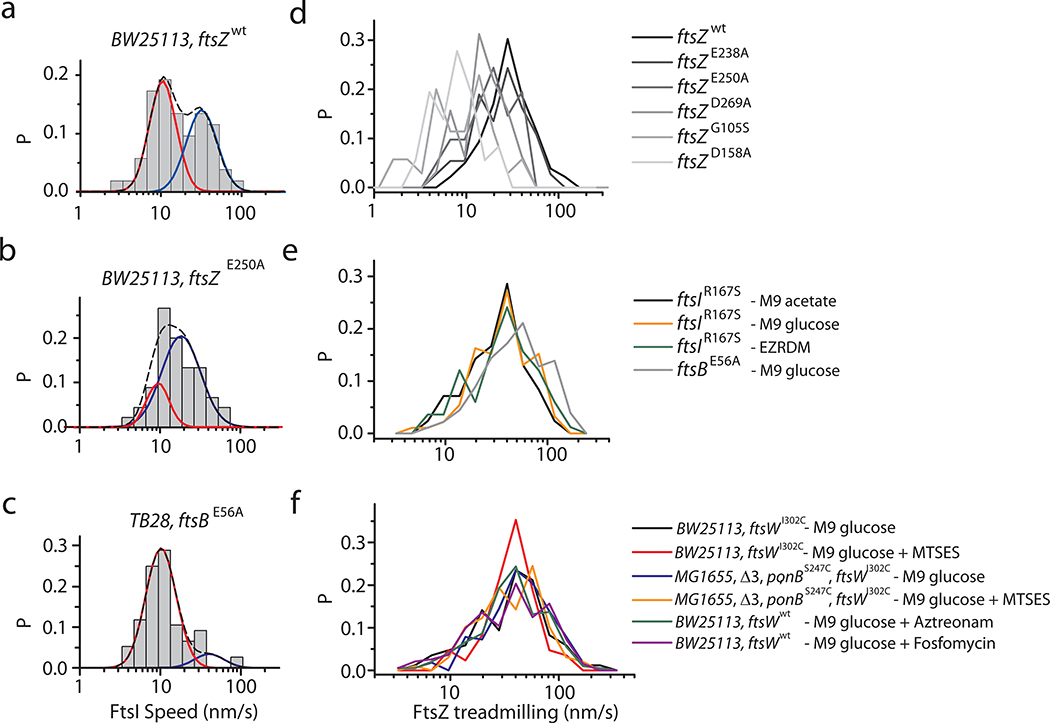
Extended Data Fig. 4. Speed distributions of processive moving RFP-FtsI molecules and FtsZ treadmilling under different conditions.
Speed distribution (bars) of all RFP-FtsI molecules in ftsZ wt (a), GTPase mutant (ftsZE250A) (b), and ftsB SF mutant (ftsBE56A) (c) strains. The CDF fit curves of fast- (blue solid) and slow- (red solid) moving population are overlaid with the bar graph. The black dash curves indicate the overall fitting. FtsZ treadmilling speed distribution in different FtsZ GTPase mutant strains (d) (Data from3), in super-fission mutant strains and different growth media (e), and under different drug treatment conditions (f). The average speeds under all conditions are given in Supplementary Tables 4 and 6.

