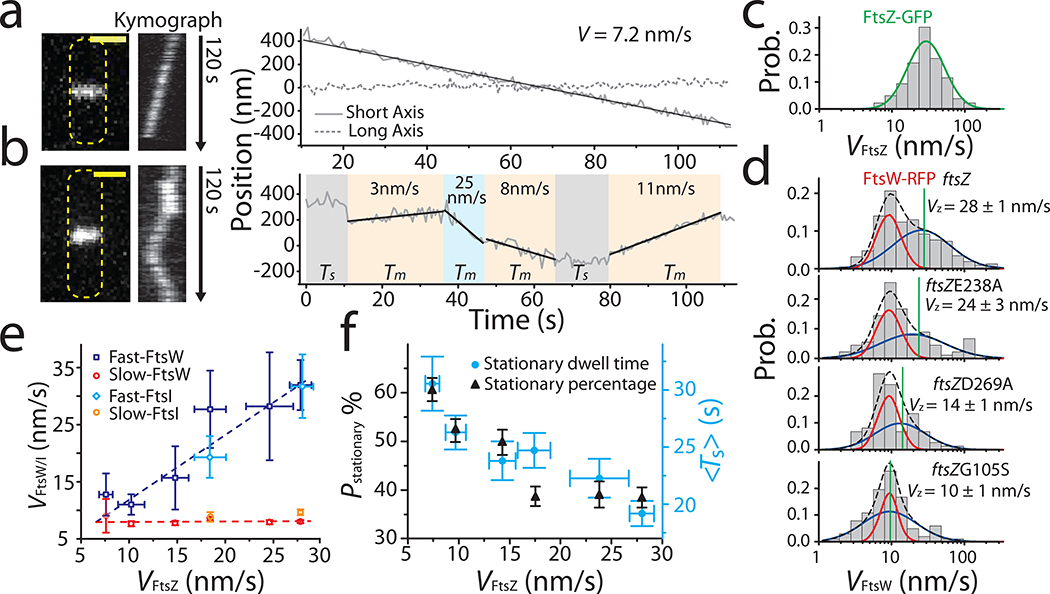
Figure 2. FtsW exhibits two processive moving populations that are differentially correlated with FtsZ’s treadmilling dynamics.
a, b: Representative maximum fluorescence intensity projection images (left), kymographs of fluorescence line scans at the septa (middle), and unwrapped one-dimensional (1D) positions of the corresponding FtsW-RFP molecule along the circumference (right, solid gray) and long axis (dot gray) of the cell. (a), one processively moving FtsW-RFP molecule and (b), one moving FtsW-RFP molecule that transitioned between different directions and speeds. The trajectory is segmented into different states of slow-moving (beige), fast-moving (pale blue), and stationary (gray). Tm: dwell time of moving segments, Ts: dwell time of stationary segments. Scale bars: 1 μm. c. Treadmilling speed distribution of WT FtsZ adapted from 3 overlaid with the single population fit curve (blue). d. Speed distributions of directional FtsW-RFP molecules in wt and ftsZ GTPase mutant strains overlaid with the double population fit curves (slow-moving population in red, fast-moving population in blue, and the overall fit curve in black dash lines). Average FtsZ treadmilling speed from 3 of each mutation strain (green line) is labeled as mean ± SEM. e. Decomposed mean speed of the fast population (blue: FtsW, cyan: FtsI) is correlated with FtsZ’s treadmilling speed while the speed of the slow-moving population (red: FtsW, orange: FtsI) is independent on FtsZ’s treadmilling speed. f. Percentage (dark triangles) and mean dwell time (cyan dots) of stationary FtsW molecules increased with reduced FtsZ treadmilling speed (left to right). e and f. Data are presented as mean ± SEM. The sample size of each point is listed in Supplementary Table 4 and 5.

