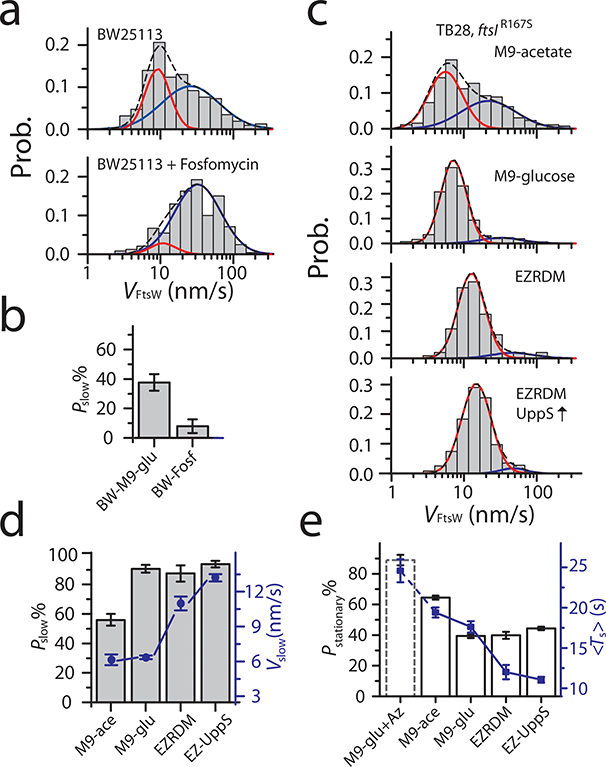
Figure 4. Rich growth condition promotes the slow-moving population of FtsW.
a-c. Histograms of directional moving speeds of FtsW-RFP (gray bar) overlaid with slow- (red) and fast-moving (blue) population fit curves, and the overall fit curve (black dash). a. FtsW-RFP in BW25113 cells in M9-glucose medium (top, replot from Fig. 2d) and treated with Fosfomycin to deplete the lipid II precursor pool (bottom). b. The slow-moving population of FtsW-RFP decreases upon depletion of lipidII (Fosfomycin treatment). c. FtsW-RFP in FtsI SF strain ftsIR167S (PM6) grown in M9-acetate, M9-glucose, EZRDM, or in EZRDM medium and with UppS overproduction (top to bottom). d. The percentage (gray bar) and average speed (blue dot) of the slow-moving population increases in media with enhanced growth conditions. e. Percentage (white bars) of stationary FtsW-RFP molecules decreases and reaches a plateau with enhanced growth conditions whereas and average dwell time (blue squares) continues to decrease. BW25113 wt cells treated with Aztreonam treatment (dashed bar, M9-glu+Az) is shown as a comparison. The corresponding constriction rates for all the growth conditions are listed in Supplementary Table 8. b, d, and e. Data are presented as mean ± SEM where the SEM is estimated by bootstrapping (For details regarding statistics and plot definitions see the “Statistics” subheading in “Methods”).

