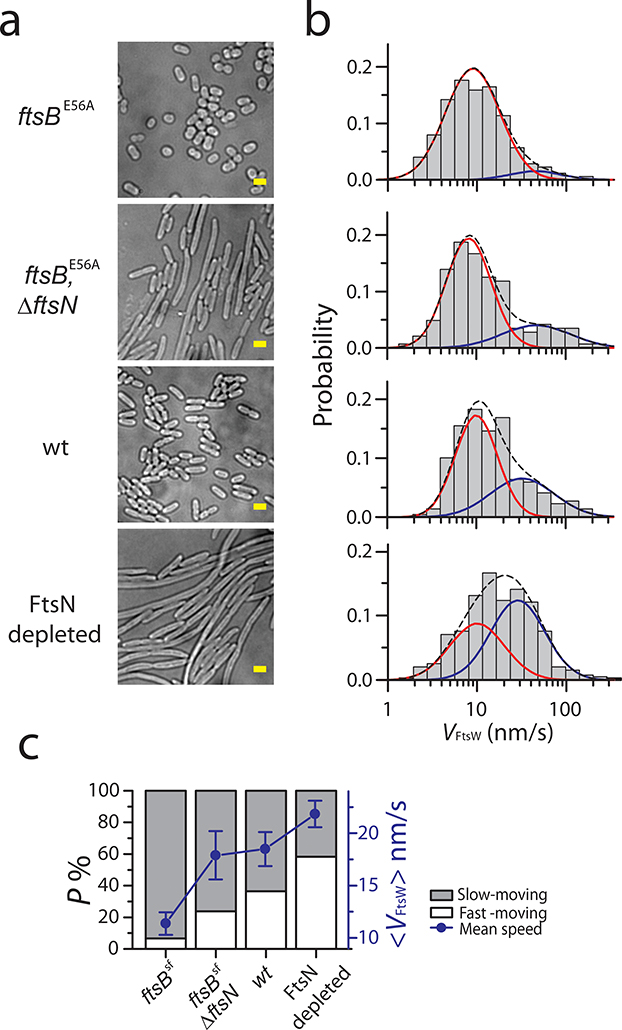
Figure 5. FtsN plays an important role in promoting the slow-moving population of FtsW.
a. Representative bright-field images of ftsBE56A (BL167), ftsBE56A ΔftsN (BL173), WT (TB28), and FtsN-depleted cells (EC1908) from three independent experiments. Scale bars: 2 μm b. Histograms of directional moving speeds of FtsW-RFP (gray bar) overlaid with slow- (red) and fast-moving (blue) population fit curves, and the overall fit curve (black dash) in cells corresponding to a on the left (in M9-glucose medium). c. Average FtsW-RFP moving speeds (blue dots) and percentage of the slow- (gray bar) and fast- (white bar) moving populations under the conditions in a-b. Data are presented as mean ± SEM. For the sample size of each point see Supplementary Table 6.

