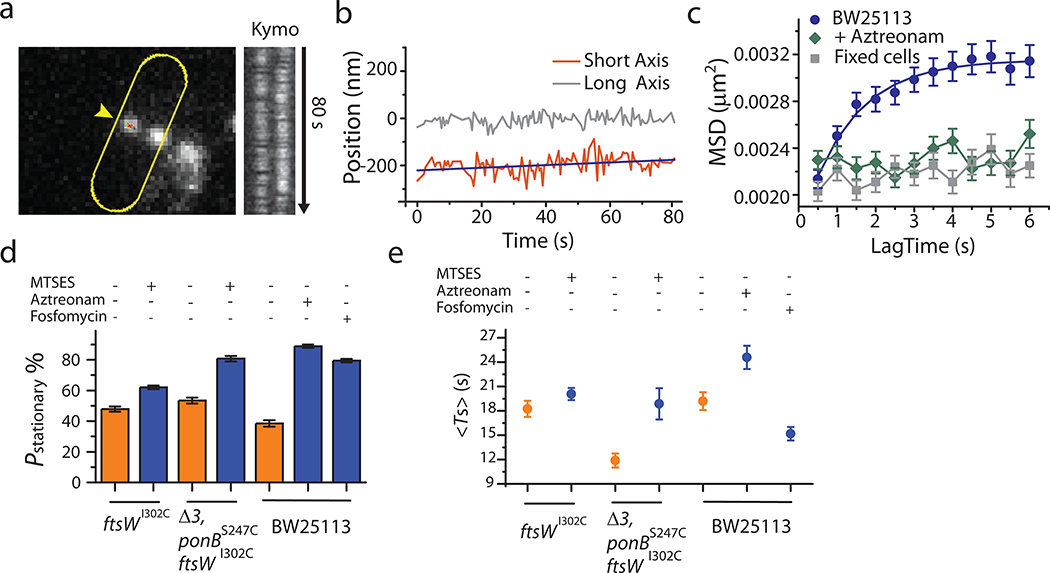
Extended Data Fig. 3. FtsW-RFP molecules in stationary state display confined diffusion.
a. Example of an FtsW-RFP molecule (arrowhead) remaining within a small region of the septum. As indicated by the kymograph, this molecule showed little observable directional movement for at least 80 seconds. b. Unwrapped and decomposed 1d-trajectory of the FtsW-RFP molecule along the long (gray) and short (orange) axis. c. 1d-MSD curves (short axis) of 204 ‘stationary’ molecules in live BW25113 WT cells growing in M9-glucose medium without (blue) or with 1μg/mL Aztreonam (dark green), and in cells grown without Aztreonam upon para-formaldehyde fixation (gray). The BW25113 curve (blue) is fit by Kusumi equation51 with D = 0.0007 ± 0.0002 μm2/s, L = 95 ± 6 nm. Note that Aztreonam treatment causes confinement of ‘stationary’ FtsW-RFP molecules to smaller areas, similar to what is observed in fixed cells. d. Percentage of FtsW-RFP molecules in stationary state in the presence (blue bars) and absence (orange bars) of drug to inhibit sPG synthesis (MTSES for FtsWI302C and PBP1BS247C, Aztreonam for FtsI, and Fosfomycin for precursor synthesis). e. Mean dwell time of FtsW-RFP molecules staying in stationary state in the presence (blue dots) and absence (orange dots) of drug to inhibit sPG synthesis. c and d. Data are presented as mean ± SEM where the SEM is estimated by bootstrapping (For details regarding statistics and box plot definitions see the “Statistics” subheading in “Methods”). e. Data are presented as mean ± SEM. For the sample size of each point see Supplementary Table 6.

