
Figure 1:
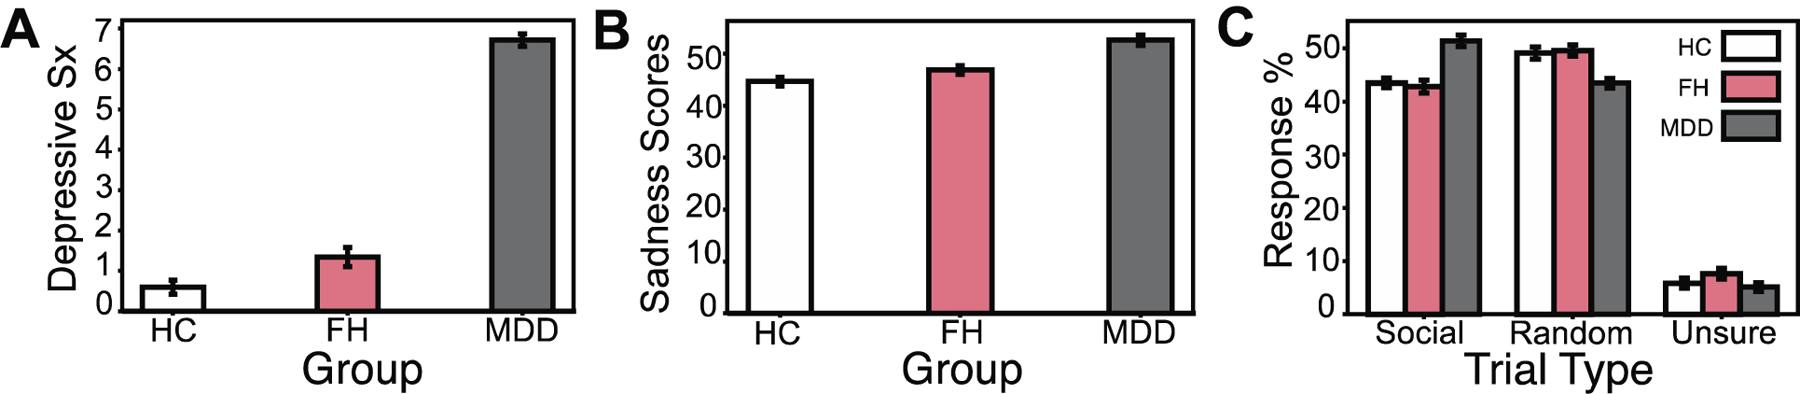
Self-reported depression symptoms and levels of sadness across depression, family history, and healthy control groups. A, Depression (MDD) group shows higher average depression symptoms compared to both individuals with a family history of depression (FH; t(172)= 19.22, p<0.01, d=2.82) and healthy controls (HCs; t(174)=27.00, p<0.01. d=24.00). Individuals in the FH group show higher depression symptoms compared to HCs (t(206)=2.54, p=0.011, d=0.35). B, Unadjusted sadness scores are significantly higher in MDD when comparing to both FH (t(172)=4.39, p<0.01, d=0.68) and HC groups (t(174)=6.11, p<0.01, d=0.93), but did not reach our significance threshold between FH and HCs (t(206)=1.88, p=0.06, d=0.26). C, Average social, random, and unsure percent responses to a Theory of Mind (ToM) social cognition task presented to participants during the fMRI scanning paradigm. Initially, MDD showed a higher percentage of ‘social’ selections relative to FH (t(172)=5.81 p<0.01, d=0.86) and HC (t(174)=5.66, p<0.01, d=0.83) groups. MDD also initially demonstrated lower percentages of ‘random’ selections relative to FH (t(172)=−3.89 p<0.01, d=−0.59) and HCs (t(174)=−3.87, p<0.01, d=−0.59). MDD and FH (t(172)=−1.81 p=0.07), MDD and HCs (t(174)=−0.57, p=0.57, d=−0.08), FH and HCs (t(206)=1.41, p=0.16, d=0.19) did not differ significantly with respect to percentage of ‘unsure’ selections throughout the task. However, after controlling for family structure in the data with PALM, any differences in performance between groups on the social cognition task were eliminated (all −log10(p) values < 1.3010, where p=0.05, corrected for multiple comparisons).