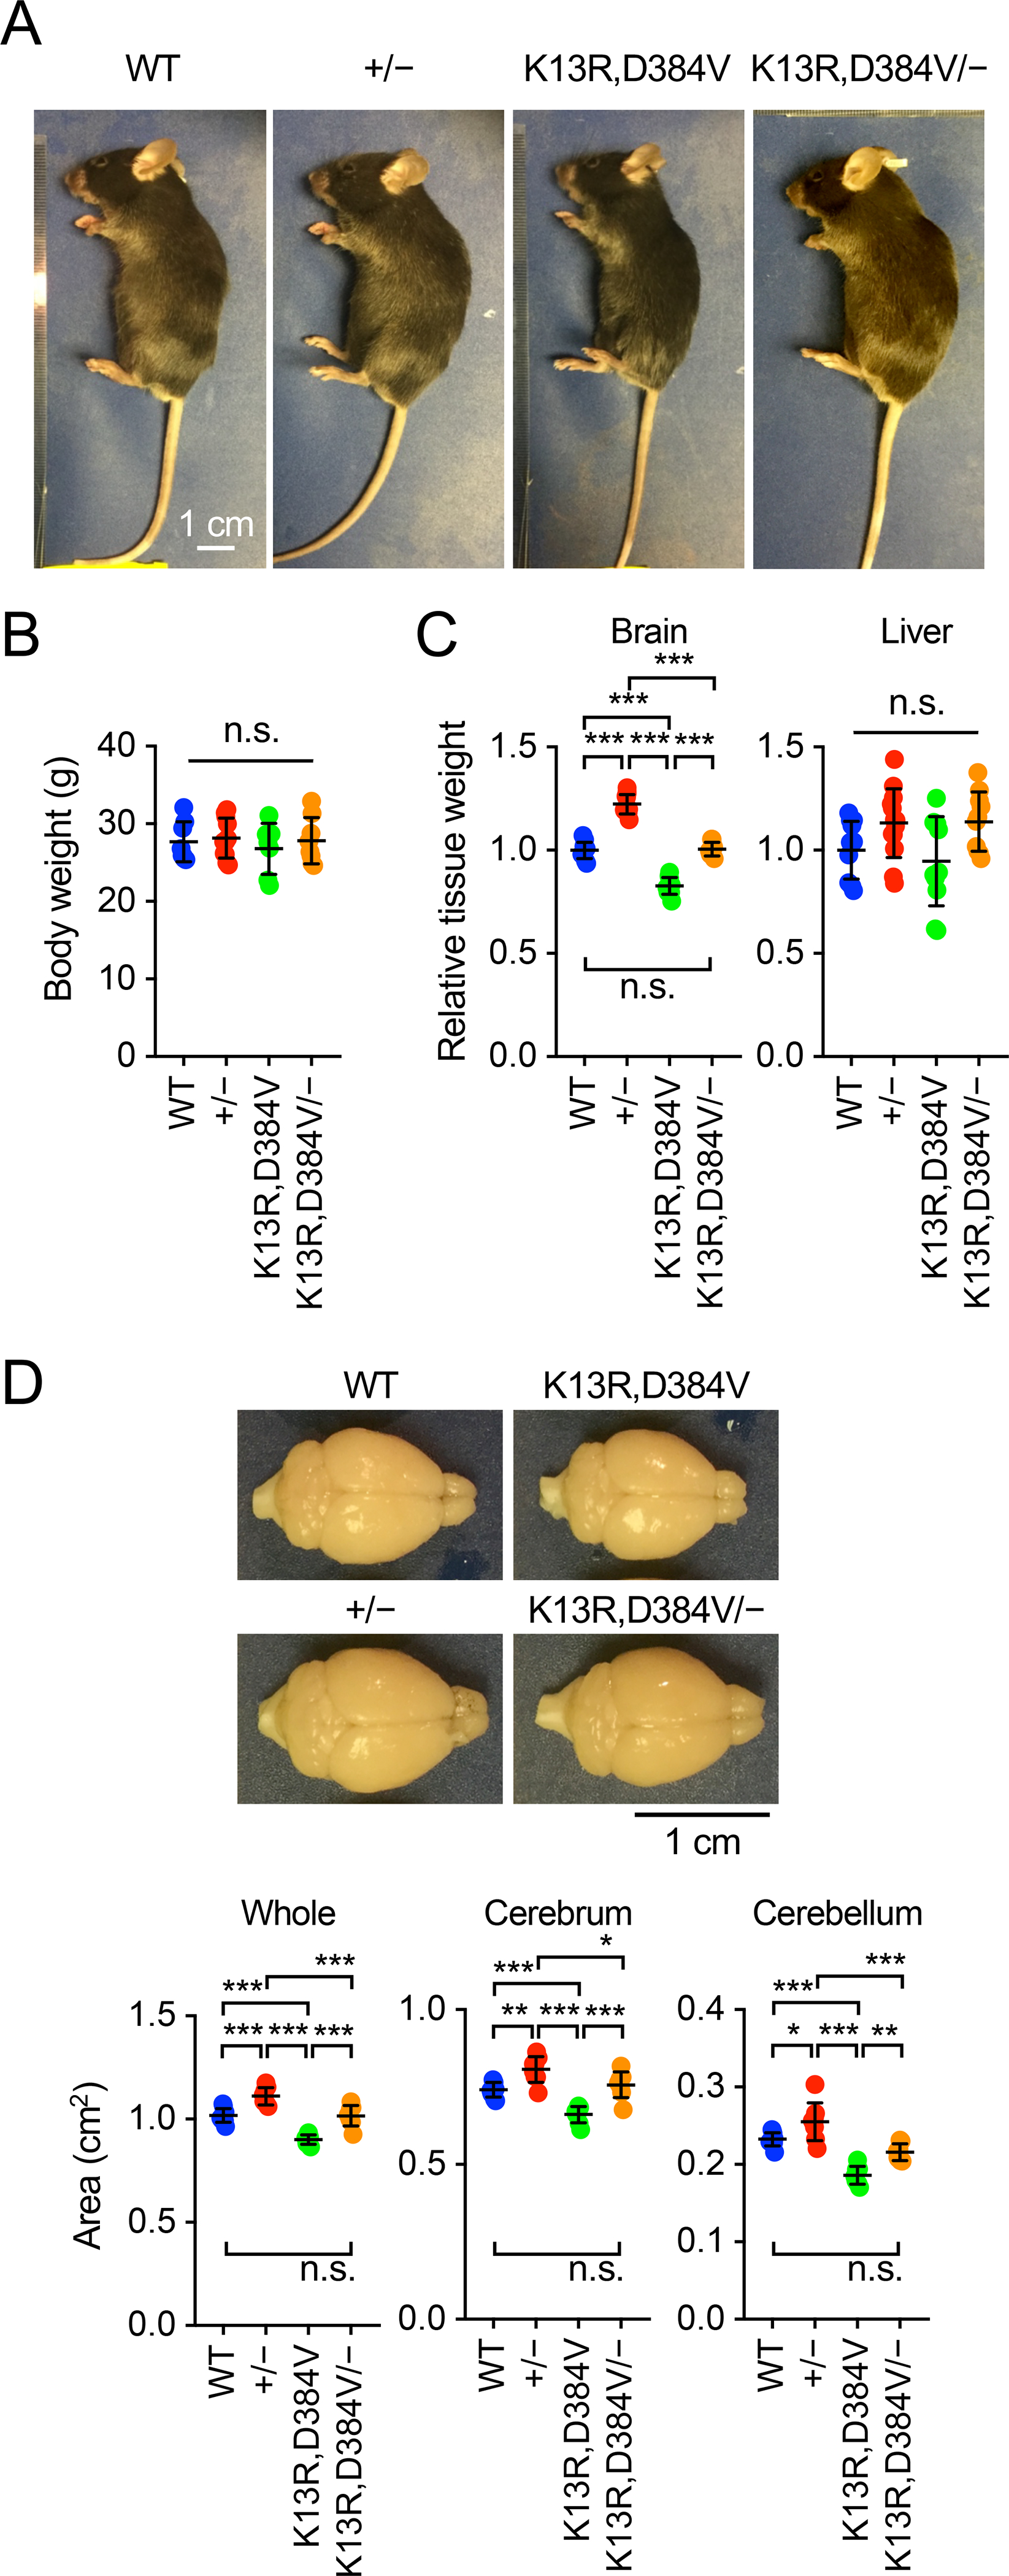
Figure 1. Brain size in PTEN mutant mice.

(A) General appearance of WT, PTEN+/−, PTENK13R,D384V/K13R,D384V, and PTENK13R,D384V/− male mice at 8–14 weeks old. (B) Bodyweight at 7–15 weeks old. Values are mean ± SD (n = 7–11 male mice). (C) Weight of the brain and liver relative to body weight at 7–15 weeks old. Values are mean ± SD (n = 10–13 male mice). (D) The area of the whole brain, cerebrum, and cerebellum was determined from the top view at 7–15 weeks old. Values are mean ± SD (n = 8–10 mice). Statistical analysis was performed using one-way ANOVA with post-hoc Tukey: *p < 0.05, **p < 0.01, ***p < 0.001.
