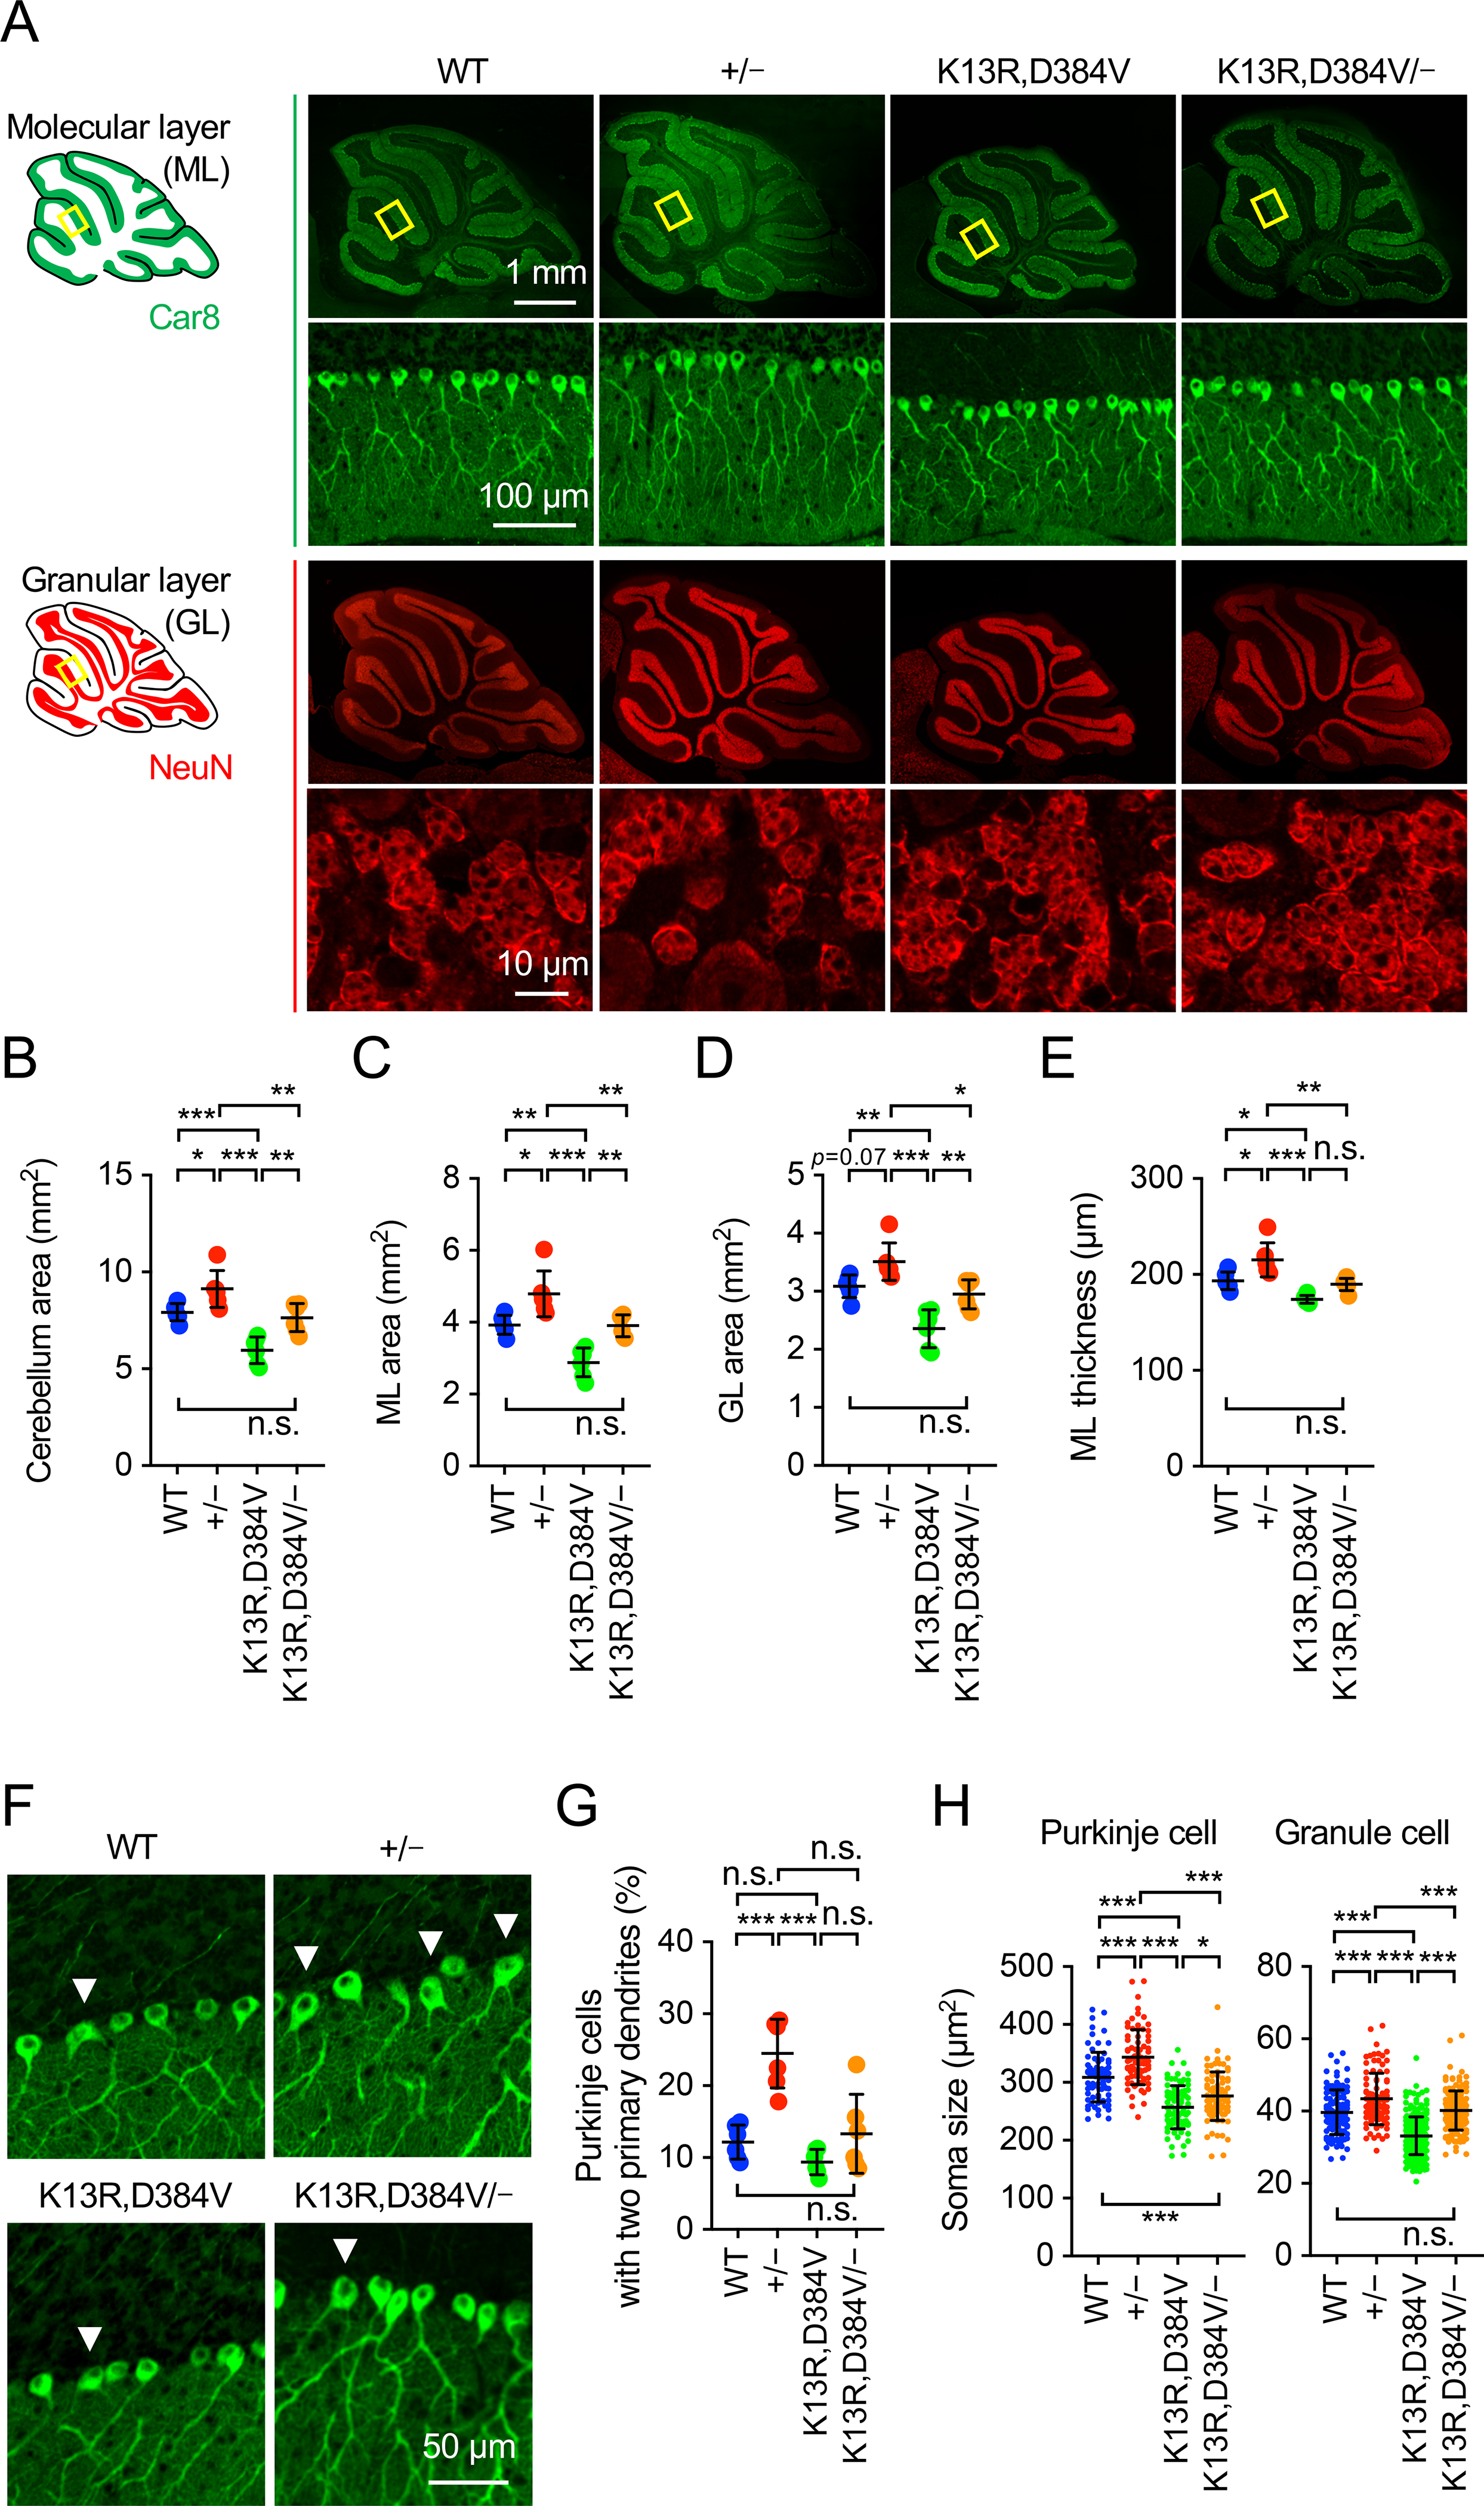
Figure 2. Size of neurons and dendritic branching in PTEN mutant cerebellum.

(A) Sagittal sections of the cerebellum cut in the midline were immunostained with anti-Car8 and anti-NeuN antibodies. Boxed regions are enlarged. (B-E) Quantification of the size of the cerebellum: area of the cerebellum (B), area of the molecular layer (C), area of the granular layer (D), and the thickness of the molecular layer (E). Values are mean ± SD (n = 6 mice). (F and G) Sagittal sections of the cerebellum in the midline were immunostained with anti-Car8 antibodies. The percentage of Purkinje cells that extend more than one dendrite from the soma was quantified. Values are mean ± SD (n = 6 mice). (H) Soma area of Purkinje cells (n = 73–85) and granule cells (n = 93–261) was quantified using Car8 and NeuN staining, respectively. Values are mean ± SD. Statistical analysis was performed using one-way ANOVA with post-hoc Tukey: *p < 0.05, **p < 0.01, ***p < 0.001.
