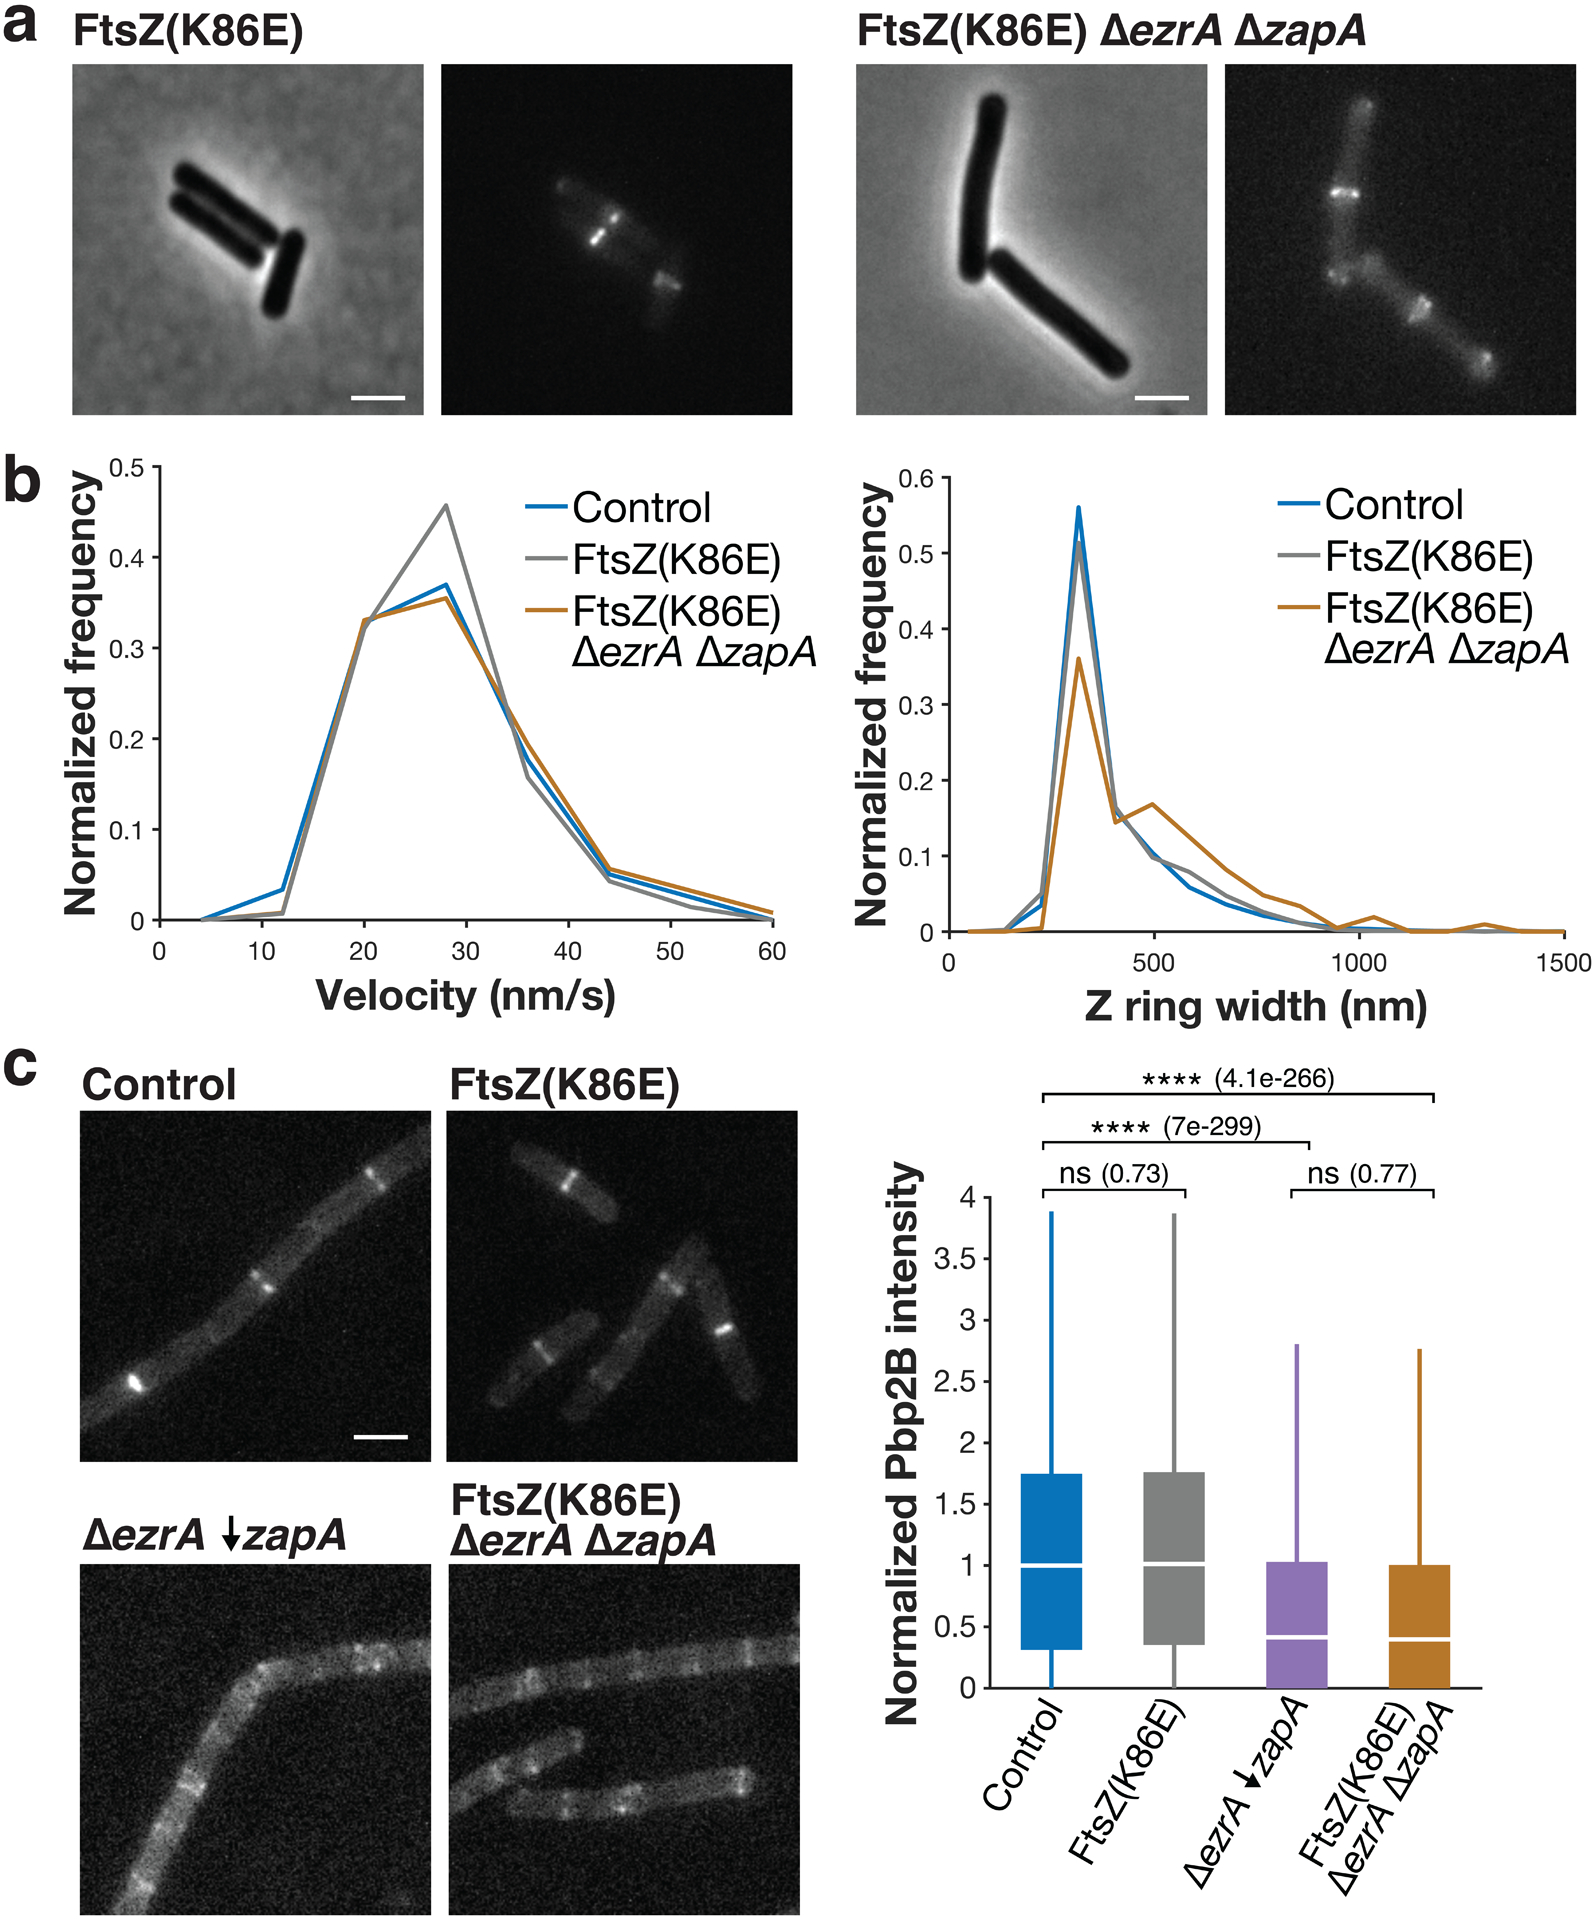
Extended Data Fig. 8. Characterization of the FtsZ(K86E) suppressor mutant.

a Each pair of images shows cell morphology (phase-contrast imaging, left), and Z ring morphology (epifluorescence images of cells expressing FtsZ-mNeonGreen induced with 20 μM IPTG for 2 hours, right) in FtsZ(K86E) and FtsZ(K86E) ΔezrA ΔzapA cells. FtsZ(K86E) Z rings look similar to the control. Z rings in FtsZ(K86E) ΔezrA ΔzapA are somewhat perturbed, but less so than typical cells missing synthetically lethal combinations of ZBPs; they also have polar Z rings, as is typical for ΔezrA strains. Representative images from at least two replicates of each condition. Scale bars: 2 μm. b FtsZ(K86E) and FtsZ(K86E) ΔezrA ΔzapA have similar FtsZ treadmilling velocities to control (left), and FtsZ(K86E) Z rings are identical in width to control, while FtsZ(K86E) ΔezrA ΔzapA are wider (right). For velocity measurements in each strain, FtsZ-mNeonGreen was induced with 20 μM IPTG for 2 hours, imaged by TIRFM, and analysed from kymographs. For Z ring width measurements, FtsZ-mNeonGreen was induced with 20 μM IPTG for 2 hours and imaged by epifluorescence. c Pbp2B intensity at midcell in FtsZ(K86E) mutant cells. Left: Representative images of Pbp2B in the indicated strains, visualized by epifluorescence imaging of cells expressing Pbp2B-mNeonGreen, from at least 4 replicates of each condition. Right: Pbp2B intensity at the division site in each strain. Although the FtsZ(K86E) restores viability in a ΔezrA ΔzapA strain, it does so without rescuing Pbp2B recruitment to midcell. For each box plot, the white line indicates the median, the box extends to the 25th and 75th percentiles, and the whiskers indicate 1.5x interquartile range. P-values were obtained from a two-sided t-test; ns indicates p > 0.5, **** indicates p<0.0001, and p-values are included in parenthesis. N>5000 division sites for each condition. Scale bars: 2 μm.
