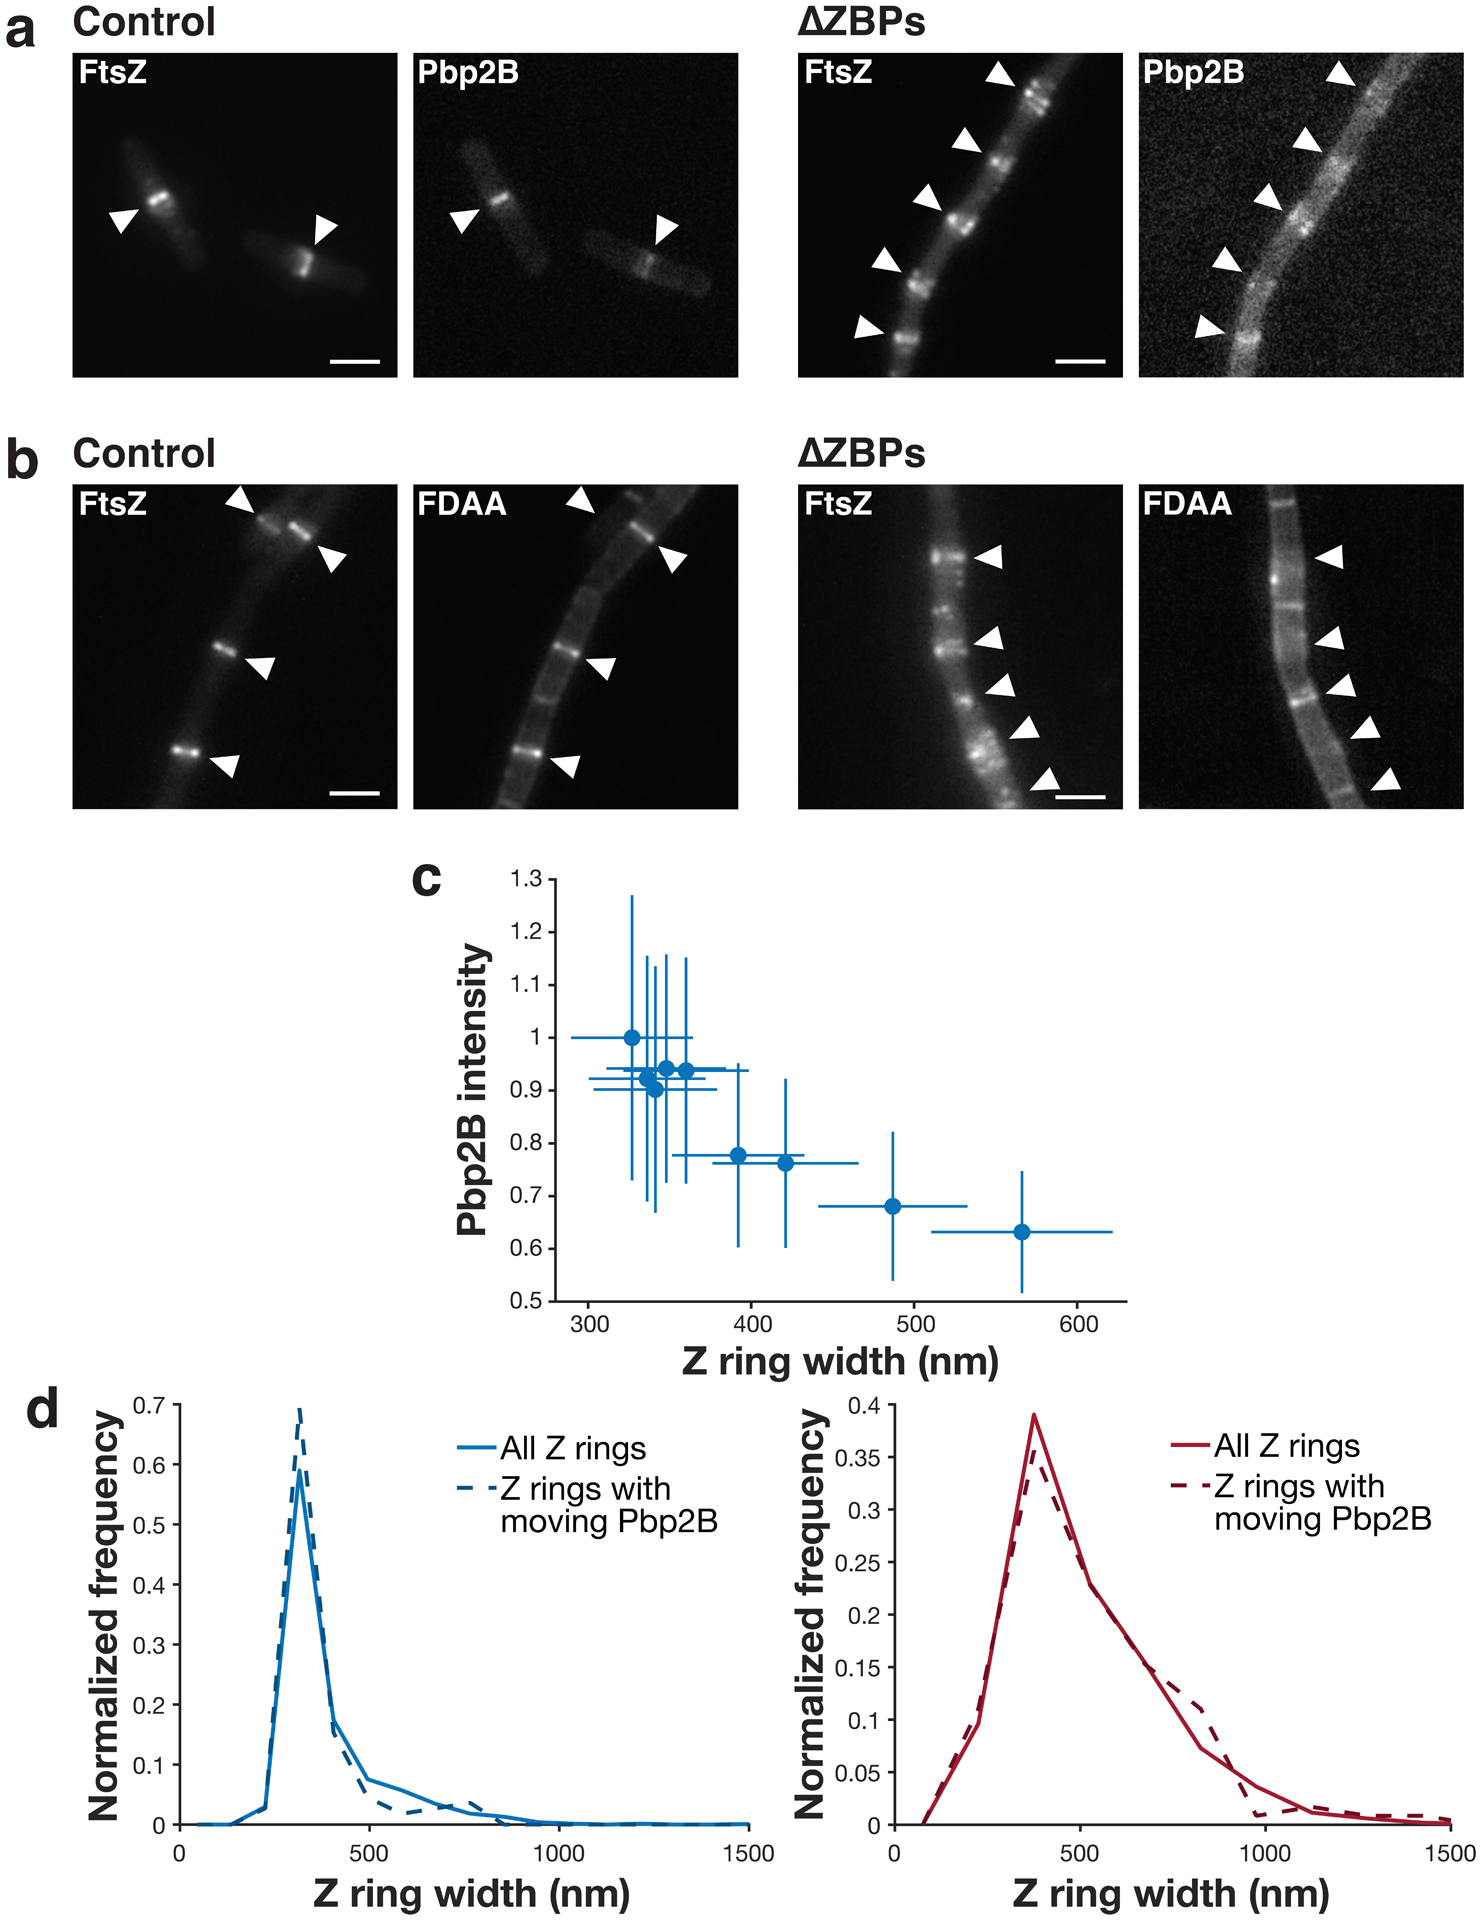
Extended Data Fig. 9. Pbp2B localization and FDAA incorporation in ΔZBPs cells.

a Z rings (left) and Pbp2B localization (right) (epifluorescence images of cells expressing both Pbp2B-mNeonGreen and FtsZ-HaloTag induced with 20 μM IPTG for 2 hours and labelled with 5 nM JF549-HTL) in control and ΔZBPs cells. White arrows indicate the Z ring positions in each image. Representative images from at least two replicates of each condition. Scale bars: 2 μm. b Z rings and fluorescent D-amino acid (FDAA) incorporation (epifluorescence images of cells labelled with 1 mM fluorescent D-lysine (FDL) for 30 seconds, right) in control and ΔZBPs cells. White arrows indicate the Z ring positions in each image. Representative images from at least 4 replicates of each condition. Scale bars: 2 μm. c Z ring width versus Pbp2B recruitment. Pbp2B intensity at midcell is higher when Z rings are more condensed; this is expected given that Pbp2B recruitment and Z ring condensation both increase over time. N = 2761 Z rings. d Pbp2B directional motion is seen at Z rings of all widths. Z ring width distributions of all Z rings (solid lines) and the Z rings at which Pbp2B moves directionally (dashed lines) for either control cells (left) or ΔZBPs cells (right) are similar. This confirms that the Pbp2B motion seen in ΔZBPs is present at decondensed rings. N>100 Z rings in each distribution. Shaded area: SEM.
