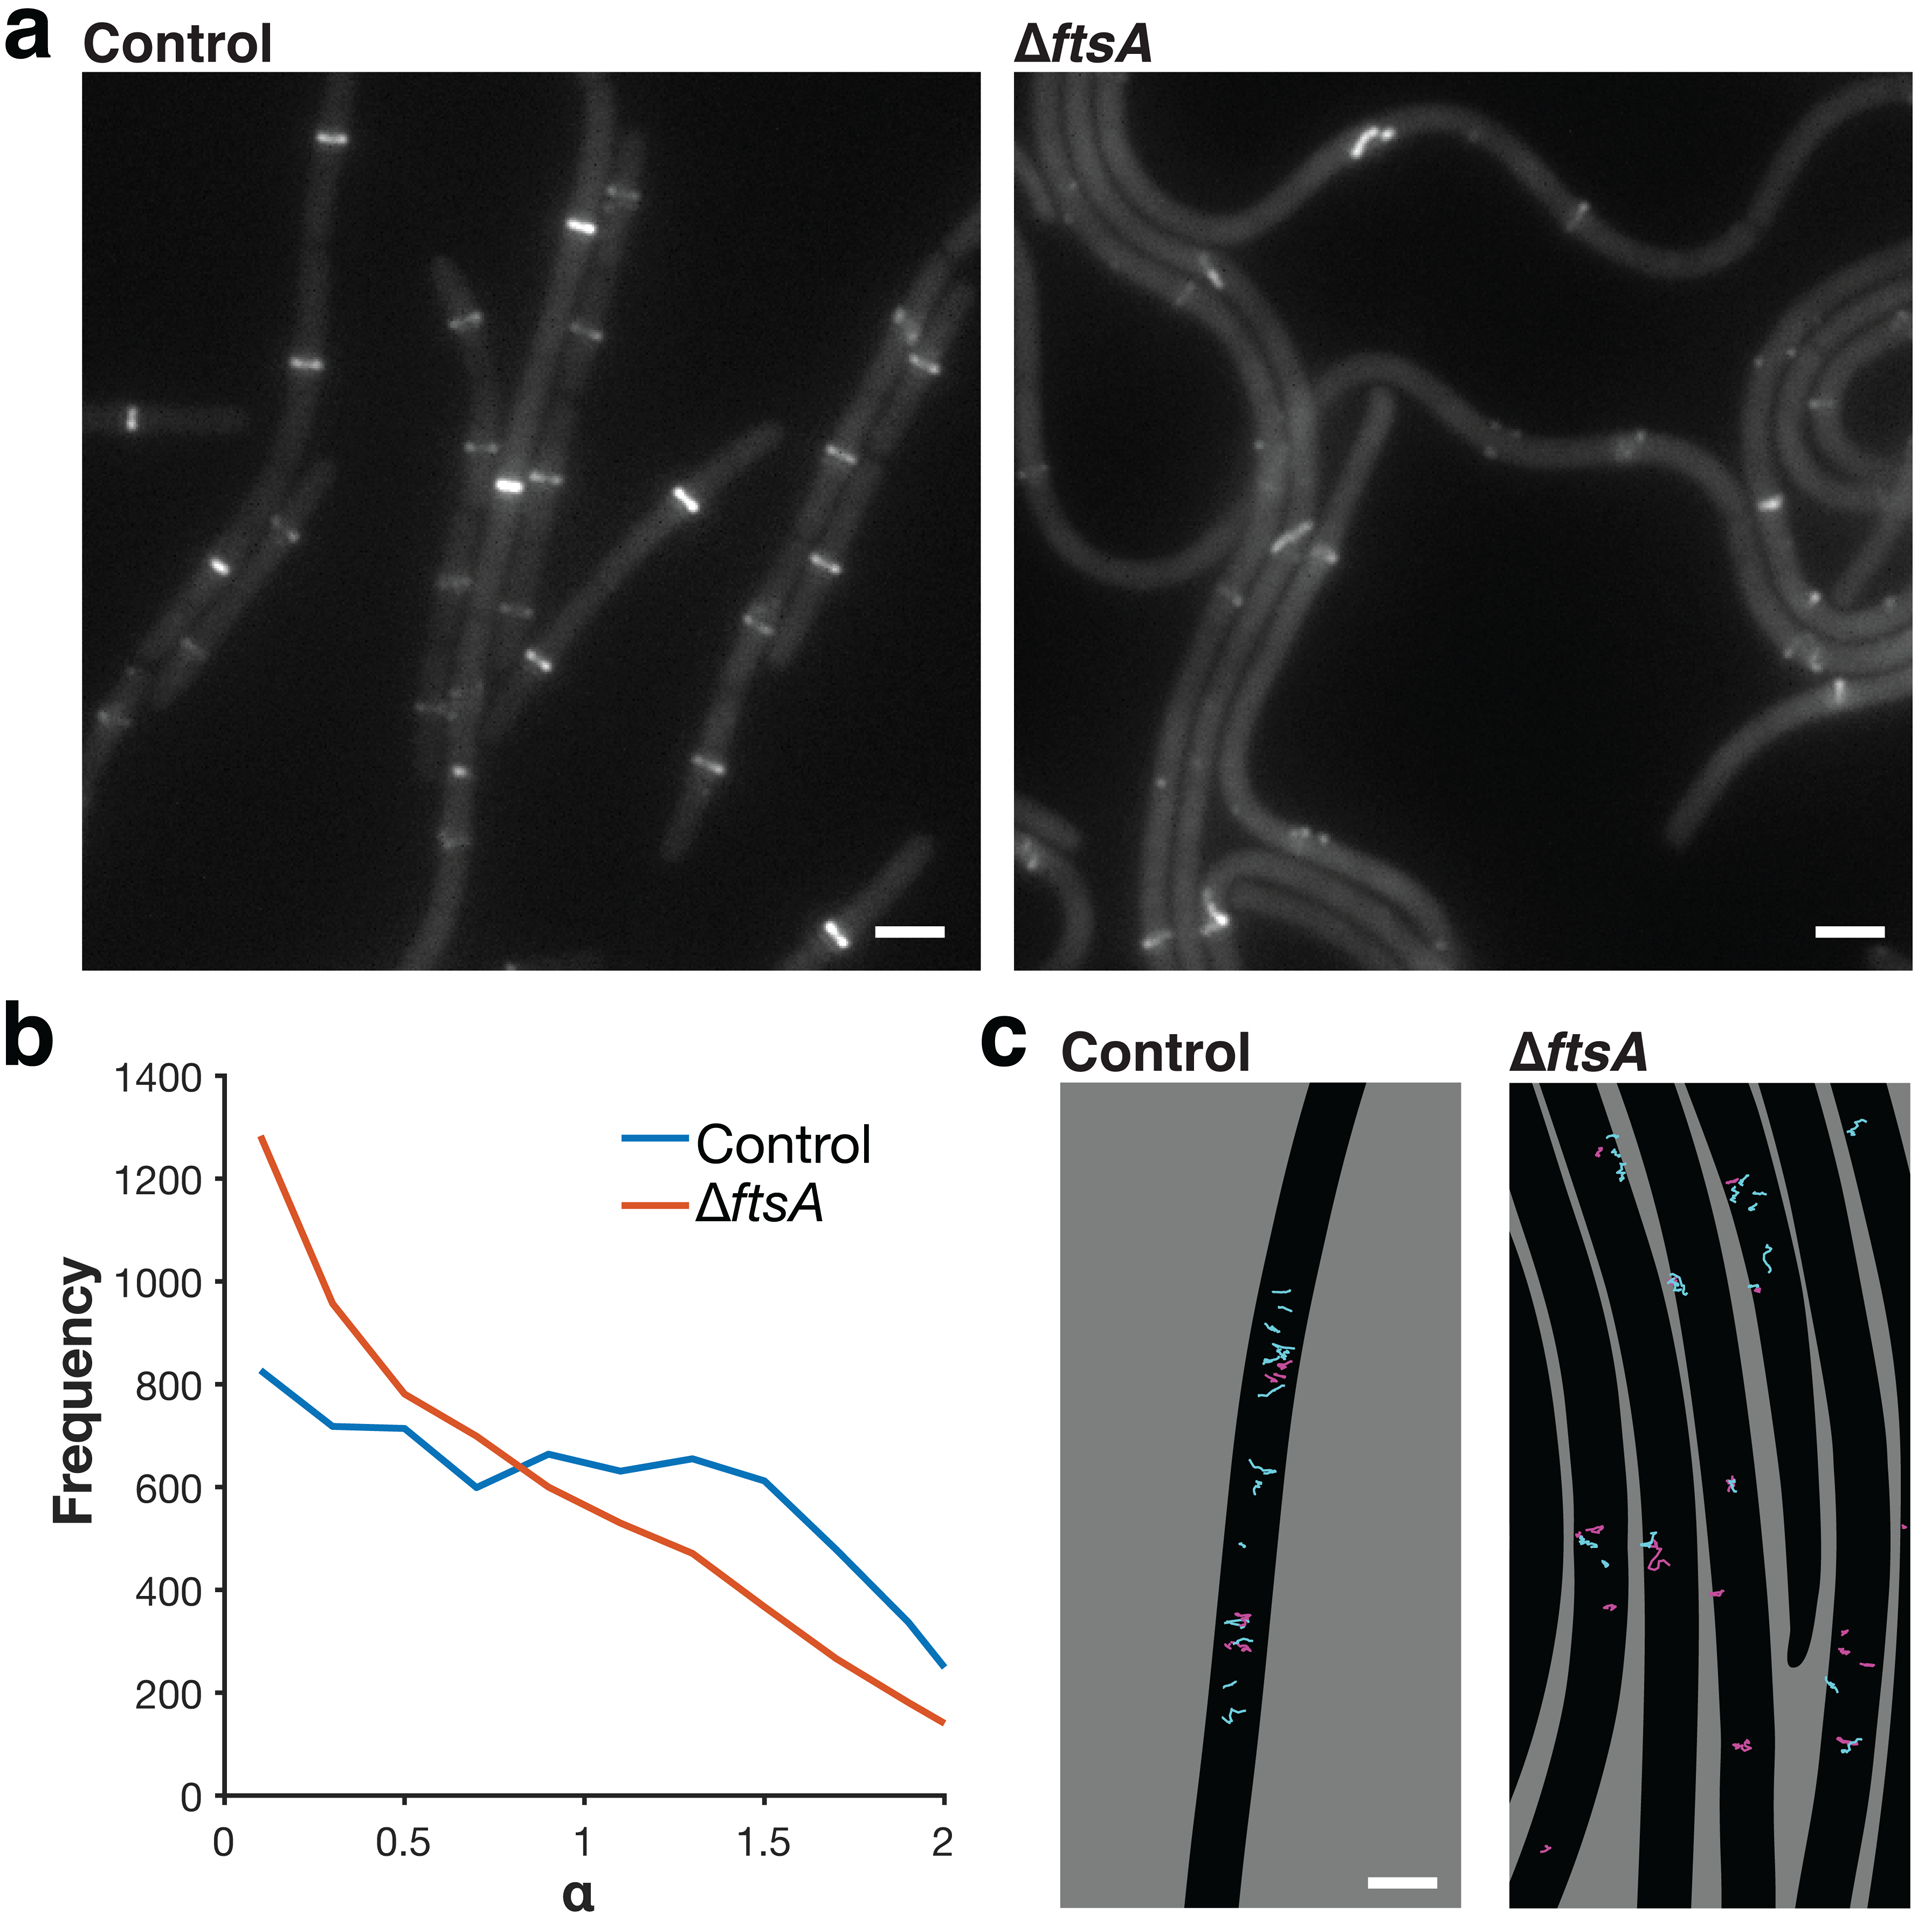
Extended Data Fig. 10. FtsA modulates FtsZ dynamics and Z ring formation.

a Z ring morphology (epifluorescence images of cells expressing FtsZ-mNeonGreen induced with 30 mM xylose for 2 hours) in control cells and ΔftsA cells. ΔftsA cells have highly altered Z rings. In ΔftsA cells, FtsZ is expressed with 10 μM IPTG from the pHyperSpank promoter; higher or lower expression levels do not allow for cell survival. Representative images from three replicates of each condition. Scale bars: 2 μm. b Distributions of α values for FtsZ motion in control and ΔftsA cells, obtained by tracking FtsZ filament motion and fitting each track to MSD(Δt) = D*Δtα. α > 1 indicates directional motion, so FtsZ filaments in ΔftsA cells exhibit less directional treadmilling compared to control cells. N>6000 tracks for each condition. c Tracks of FtsZ filament motion in control and ΔftsA cells. Tracks with α > 1 are cyan, tracks with α ≤ 1 are magenta. In control cells, FtsZ filaments often treadmill directionally along the short axis of the cell. In ΔftsA cells, directional motion occurs less frequently and follows the short axis of the cell less consistently. Segmented cells are shown in black on a grey background. Scale bars: 2 μm.
