
Figure 2: FtsZ lifetime reports treadmilling dynamics in vivo.
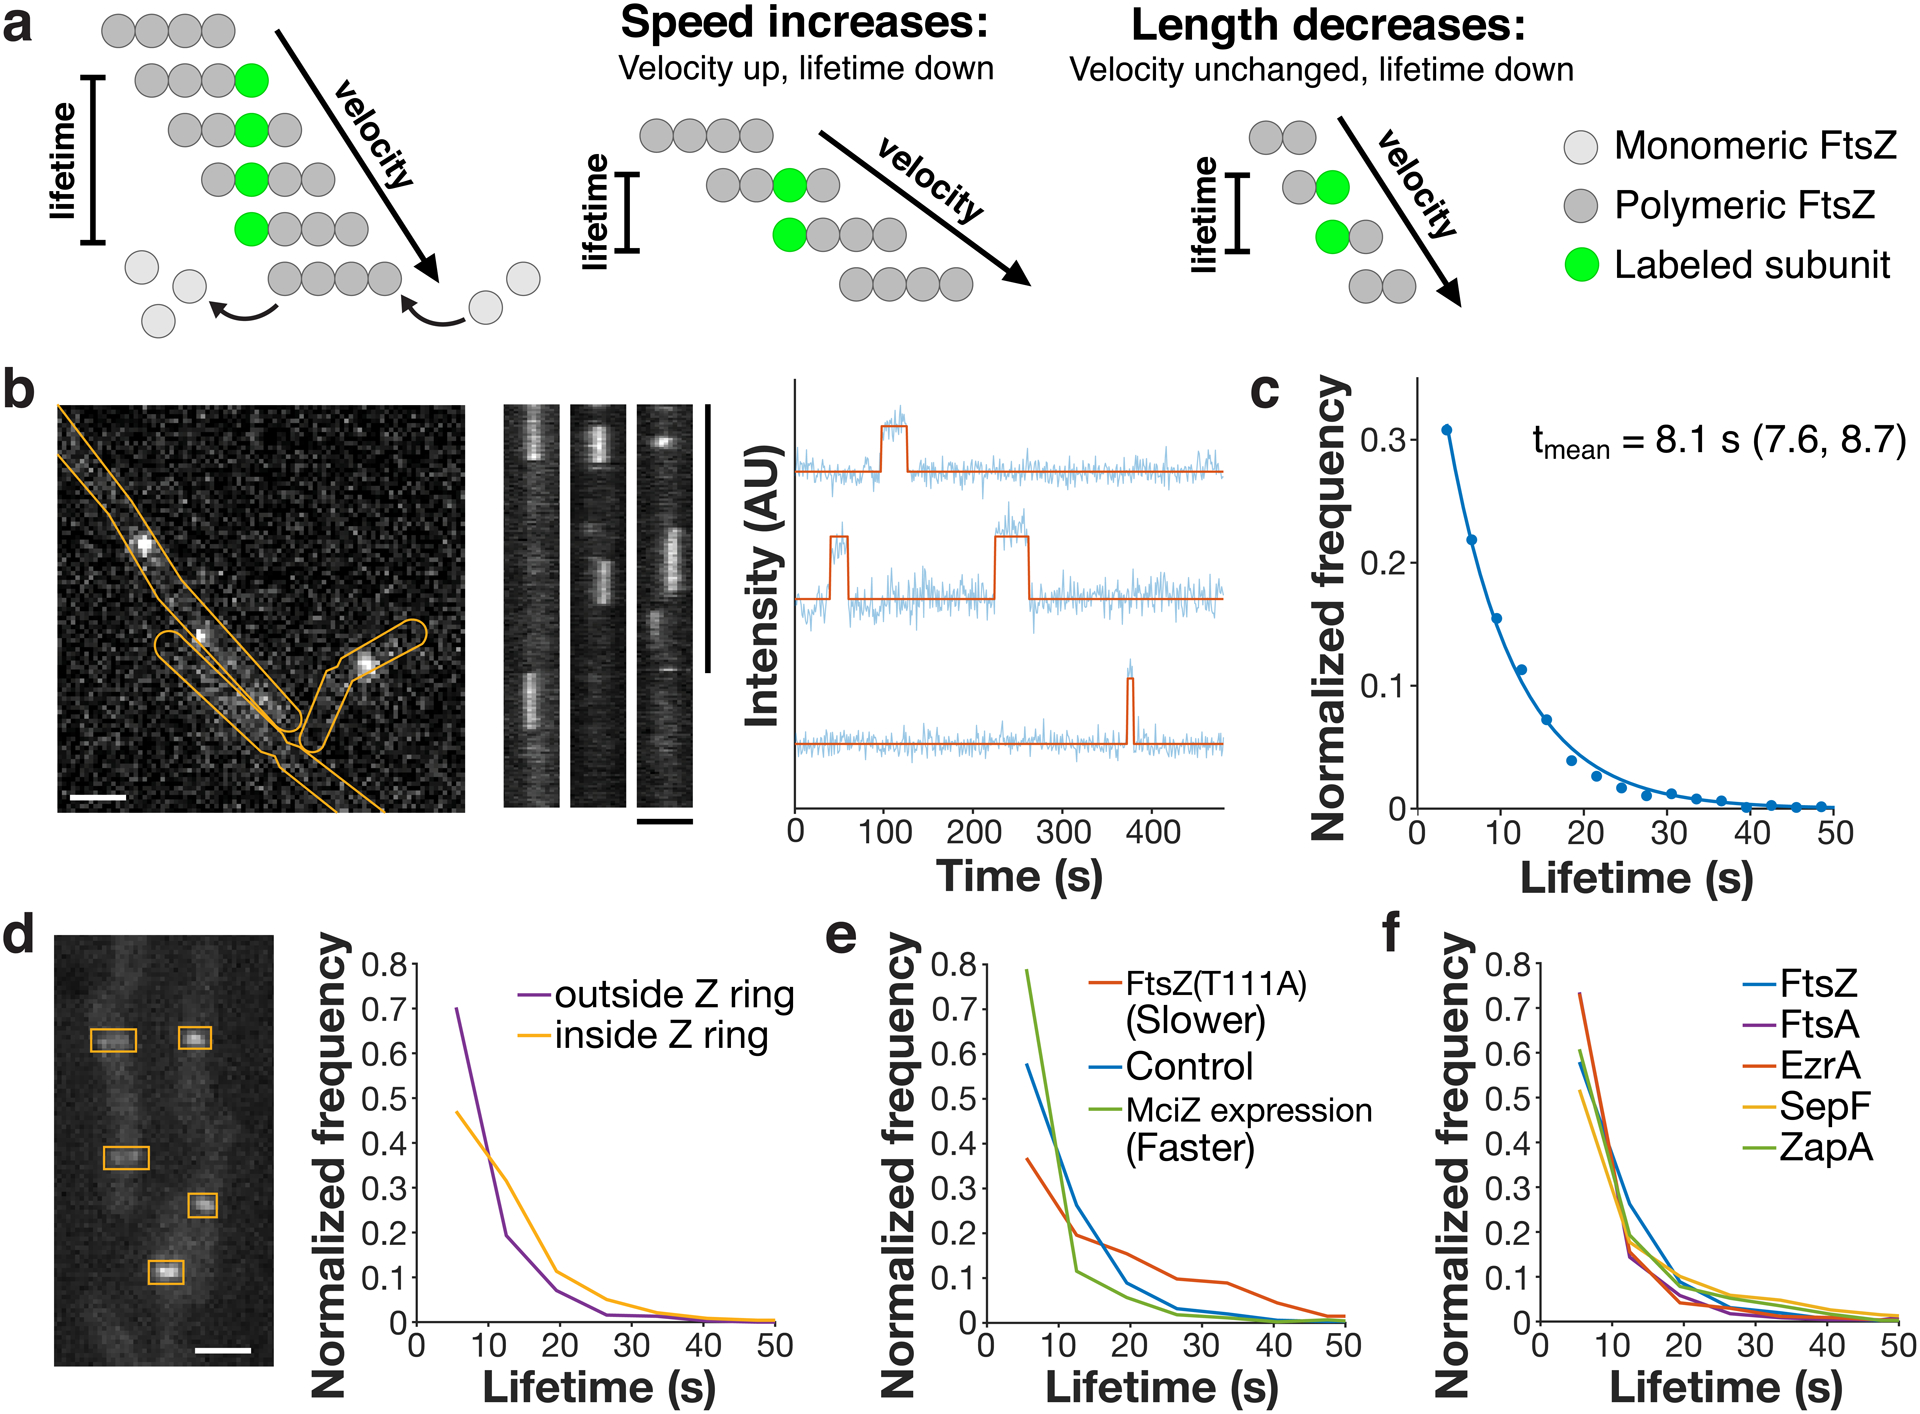
a Left: Velocity and lifetime can be measured independently for a treadmilling filament. Velocity is measured by imaging the motion of FtsZ filaments (dark grey circles), whereas lifetime is measured from the dwell time of a single labelled subunit (green circle) in the filament. Centre: If the speed of a FtsZ filament changes, this changes both the measured velocity and lifetime. Right: If the length of a FtsZ filament changes, the lifetime will change, but velocity will not. Thus, lifetime reflects both treadmilling speed and filament length, whereas velocity is insensitive to filament length. b Lifetimes were measured by live-cell single-molecule TIRFM (left) of stationary FtsZ subunits (kymographs, centre). Representative images from 17 replicates. Intensity traces were fit to a hidden Markov model to measure single-molecule lifetimes (right). c FtsZ subunit lifetime distribution, fit to a single exponential f(t) = Ae−τt. tmean: mean lifetime and 95% confidence interval, measured from this fit. d Left: mNeonGreen-Pbp2B was imaged by epifluorescence microscopy, and ROIs were drawn around Z rings. Representative image from 4 replicates. Right: Lifetime distributions of FtsZ inside and outside of Z rings, classified by colocalization with ROIs. e FtsZ subunit lifetime distributions in conditions that change treadmilling speed. f Lifetime distributions of FtsZ, FtsA, and the ZBPs. Scale bars: horizontal: 2 μm, vertical: 1 min.