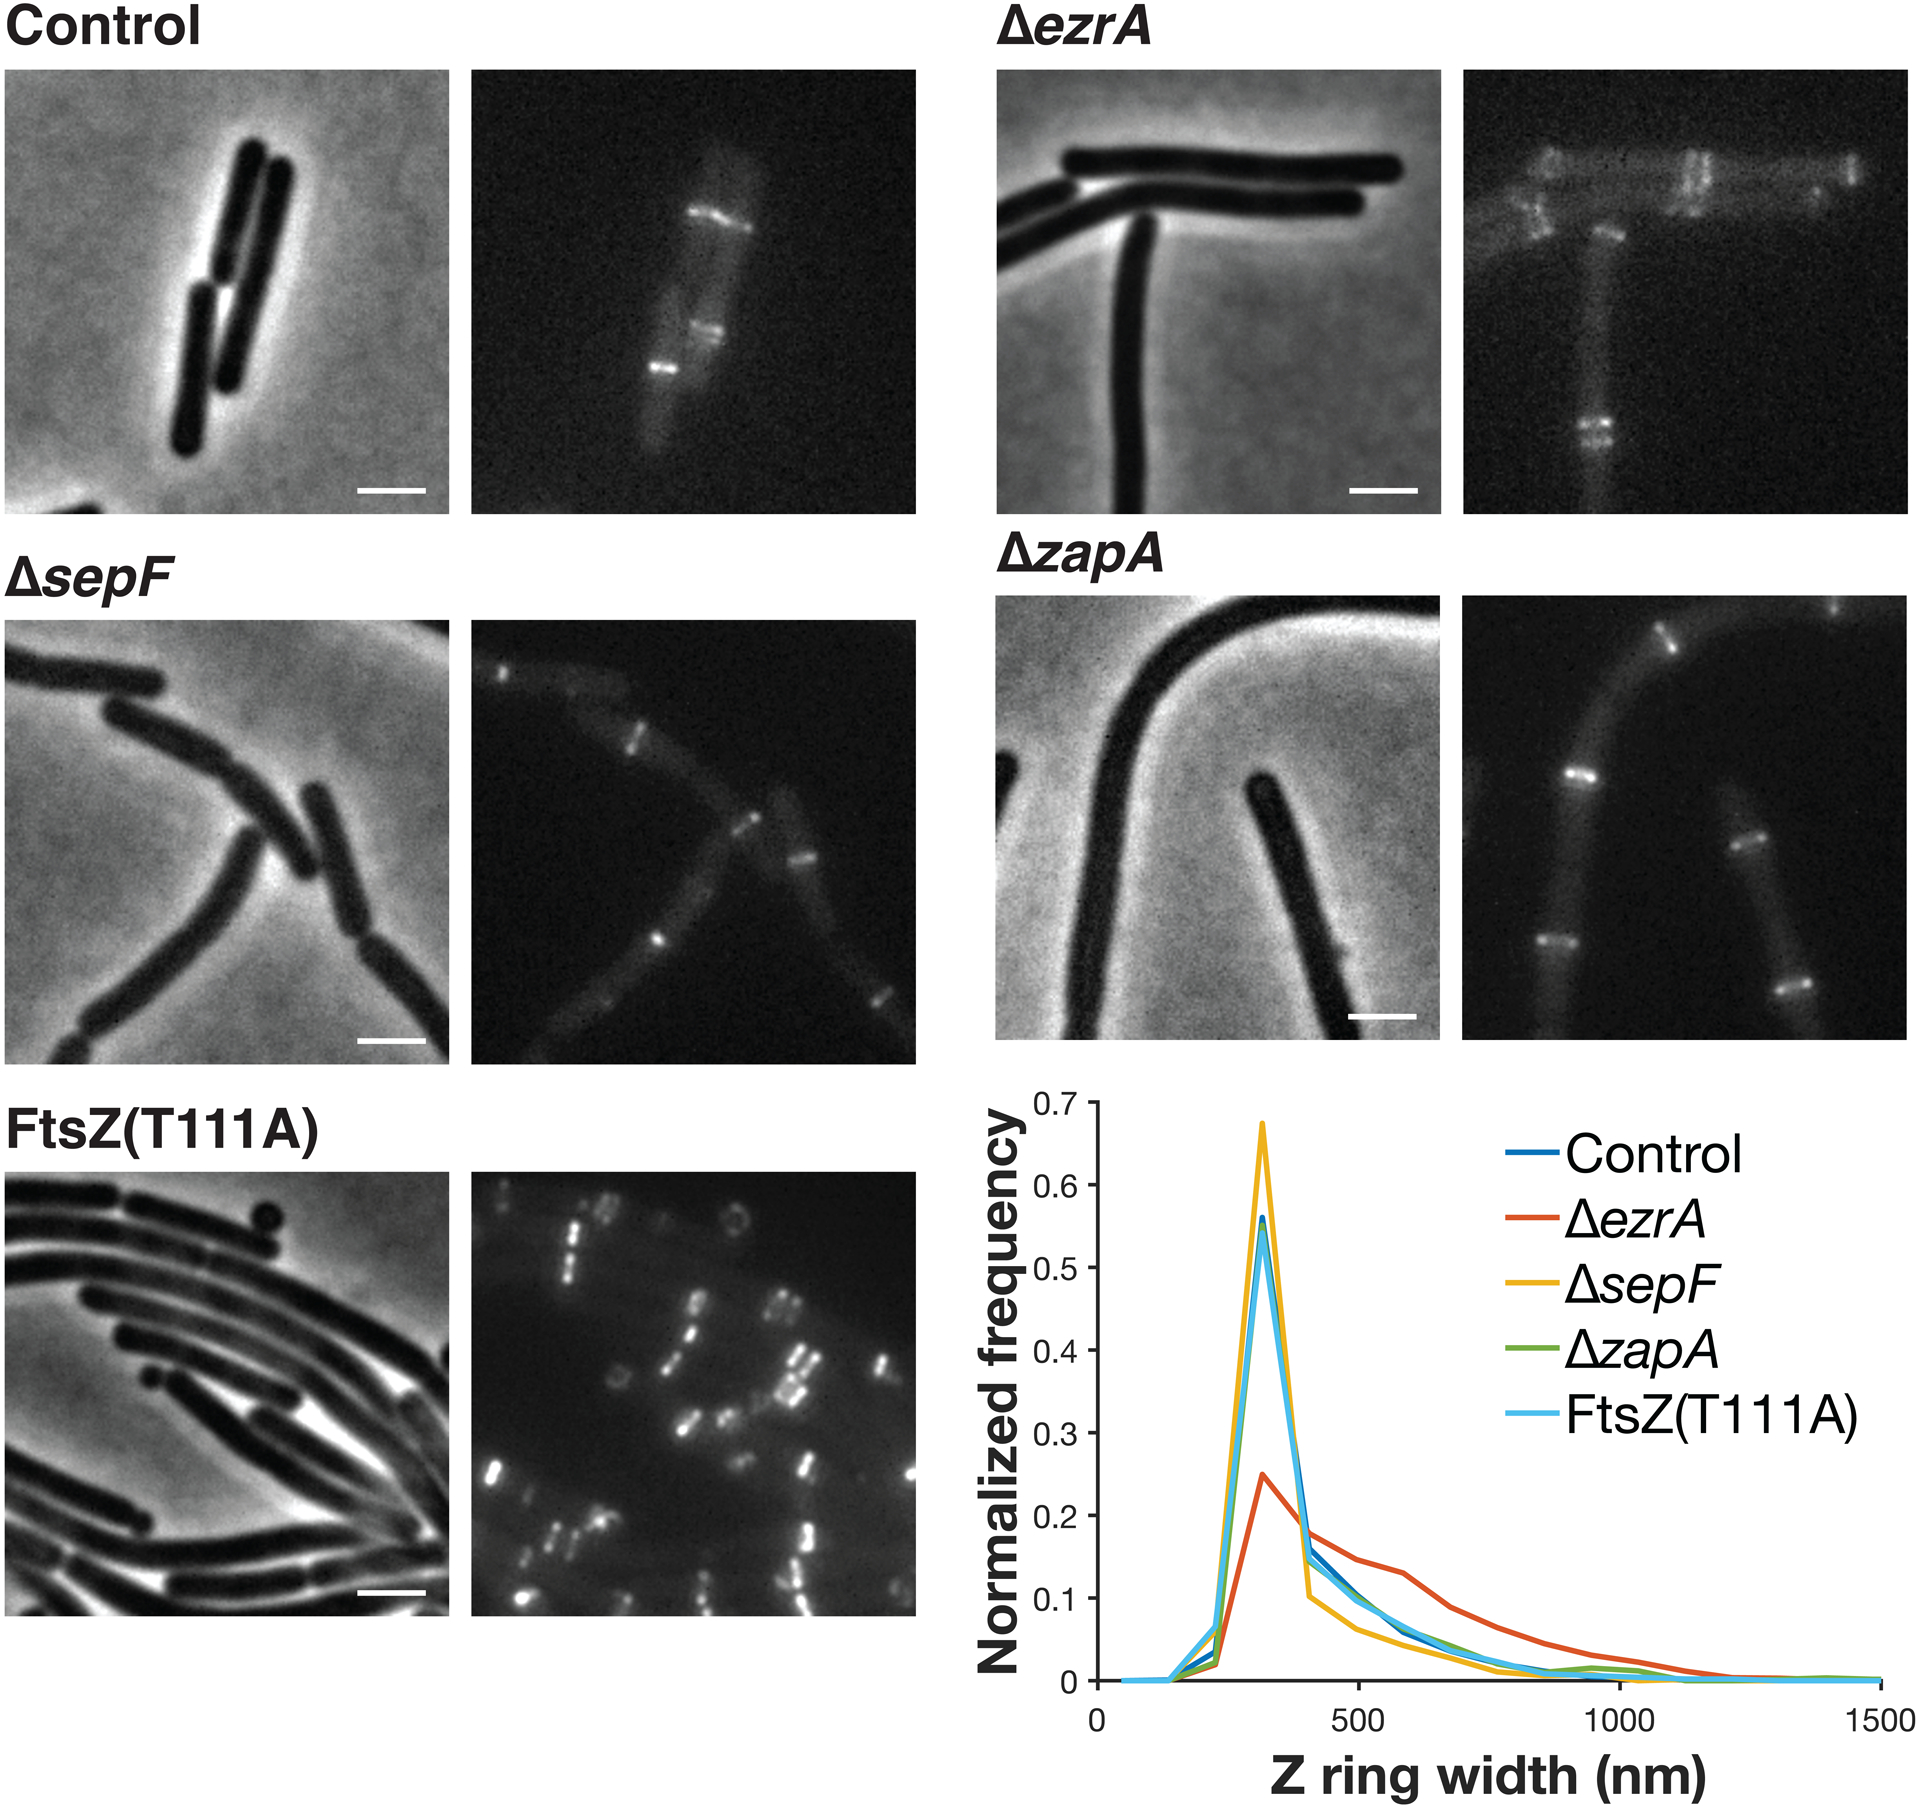
Extended Data Fig. 3. Effects of individual ZBP knockouts on cell and Z ring morphology.

Each pair of images shows cell morphology (phase-contrast imaging, left), and Z ring morphology (epifluorescence images of cells expressing FtsZ-mNeonGreen induced with 20 μM IPTG for 2 hours, right) in control cells, compared to cells with individual ZBPs deletions. ΔezrA cells less condensed Z rings, along with the expected Z rings near their poles33; ΔsepF and ΔzapA cells have normal Z rings. FtsZ(T111A) mutant cells have excess Z rings and form mini-cells. The distribution of Z ring widths in each strain is plotted at bottom left. Representative images from at least two replicates of each condition. Scale bars: 2 μm.
