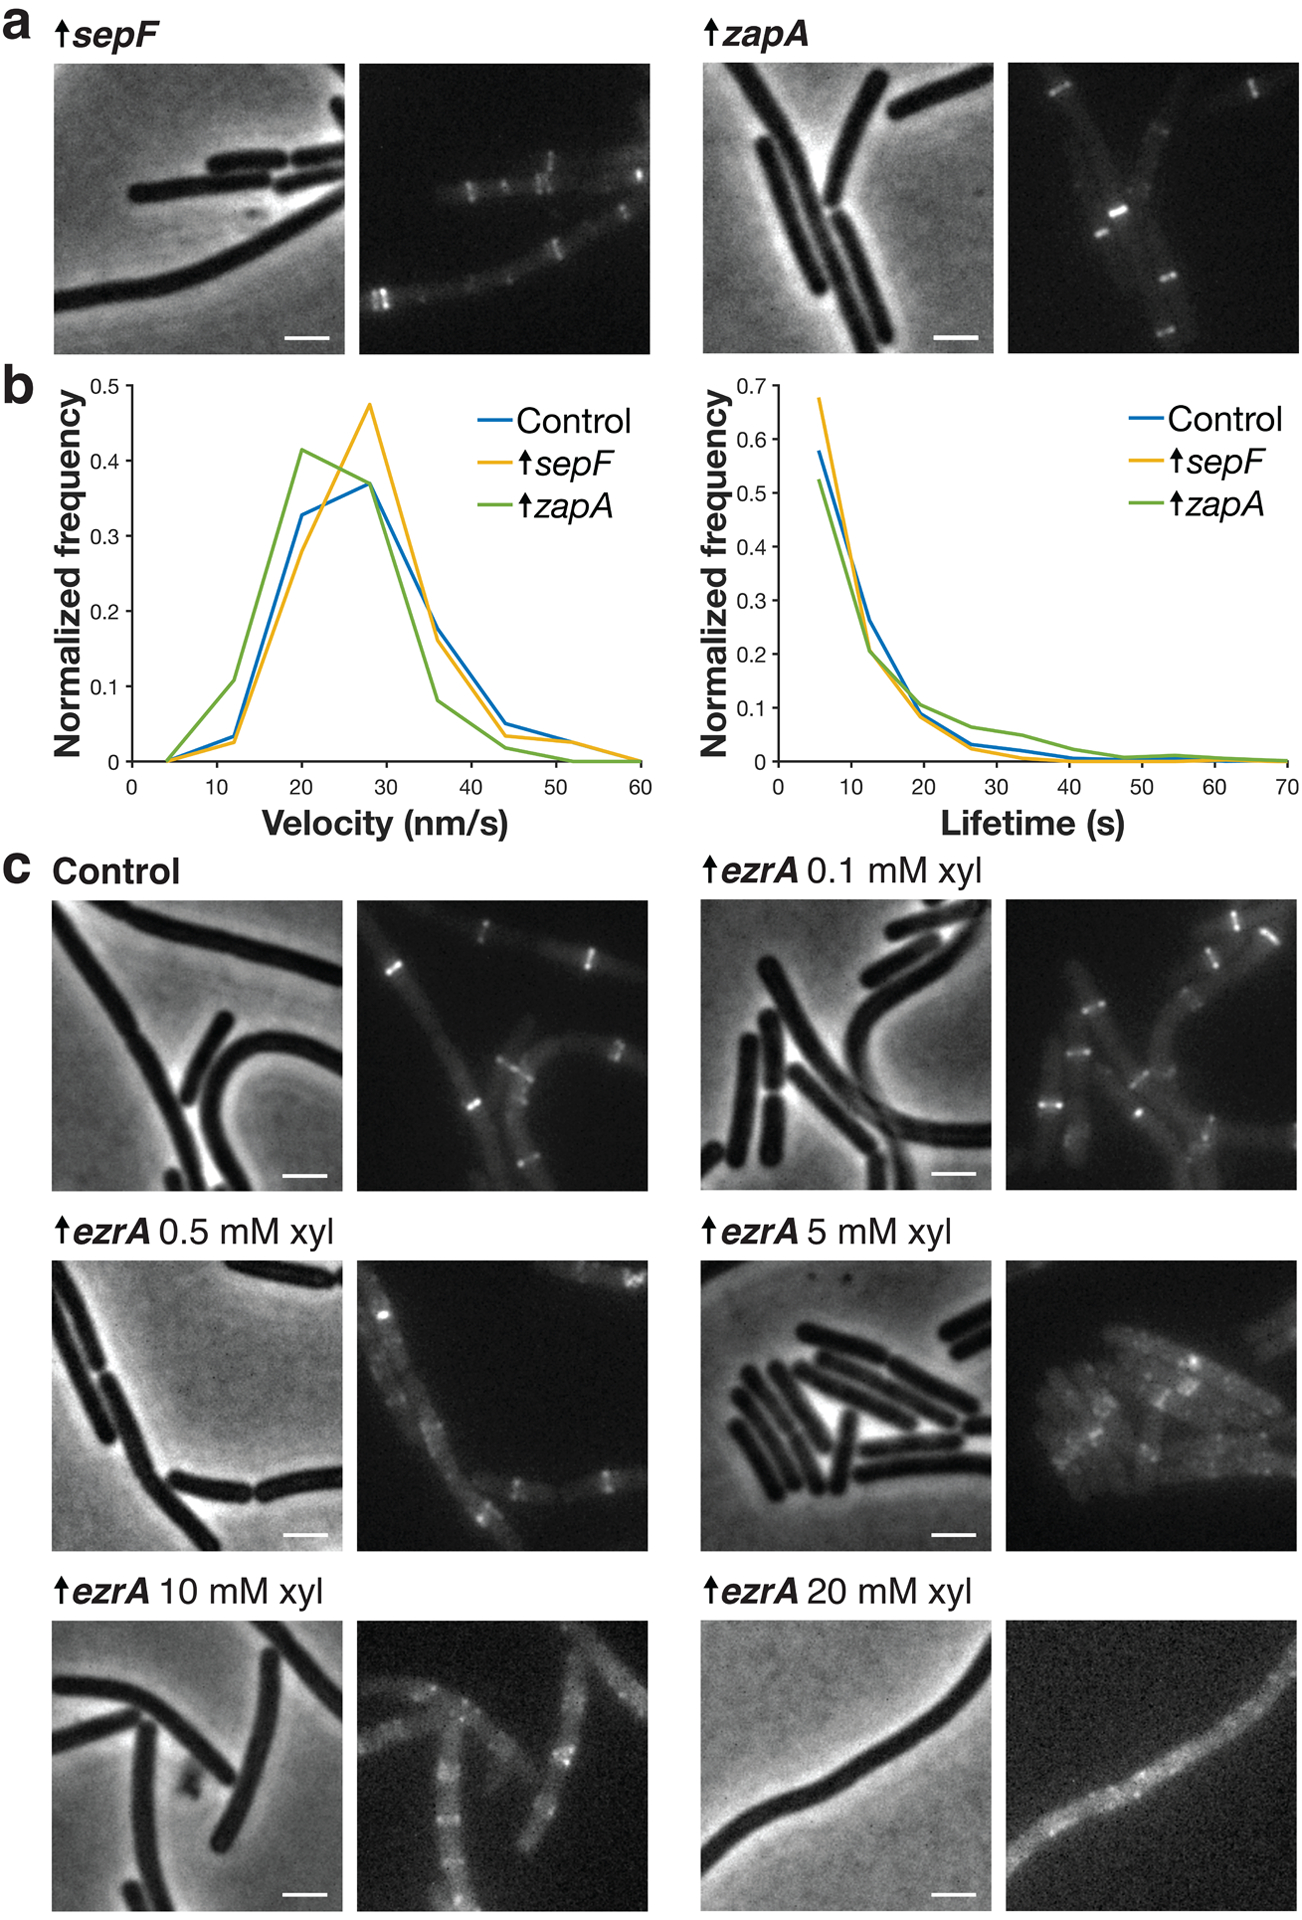
Extended Data Fig. 4. Effects of ZBP overexpression on FtsZ.

a Each pair of images shows cell morphology (phase-contrast imaging, left), and Z ring morphology (epifluorescence images of cells expressing FtsZ-mNeonGreen induced with 20 μM IPTG for 2 hours, right), in cells overexpressing SepF and ZapA. These cells have normal Z ring morphology except for some polar Z rings in SepF-overexpressing cells. Second copies of sepF and zapA were expressed from a xylose-inducible promoter with 30 mM xylose for 2 hours. Representative images from at least two replicates of each condition. Scale bars: 2 μm. b sepF- and zapA-overexpressing cells have similar FtsZ treadmilling velocities (left) and subunit lifetimes (right) to control cells. For velocity measurements, FtsZ-mNeonGreen was induced with 20 μM IPTG for 2 hours, imaged by TIRFM, and analysed from kymographs. For lifetime measurements, FtsZ-HaloTag was induced with 20 μM IPTG for 2 hours and labelled with 40 pM JF549-HTL. c Each pair of images shows cell morphology (phase-contrast imaging, left), and Z ring morphology (epifluorescence images of cells expressing FtsZ-mNeonGreen induced with 20 μM IPTG for 2 hours, right), in control cells and cells with EzrA overexpressed. EzrA-overexpressing cells have perturbed Z ring morphology, as expected30, a phenotype exacerbated with increasing induction. A second copy of ezrA was expressed from a xylose-inducible promoter by adding xylose at the indicated mM concentration. The 0.1, 0.5, and 5 mM concentrations were selected for quantitative analysis as the 10 and 20 mM xylose overexpression yielded unstable FtsZ filaments whose lifetimes were too short to be measured accurately. Representative images from at least two replicates of each condition. Scale bars: 2 μm.
