
Figure. 1. EODF attenuates elevated BP in SHRSP.
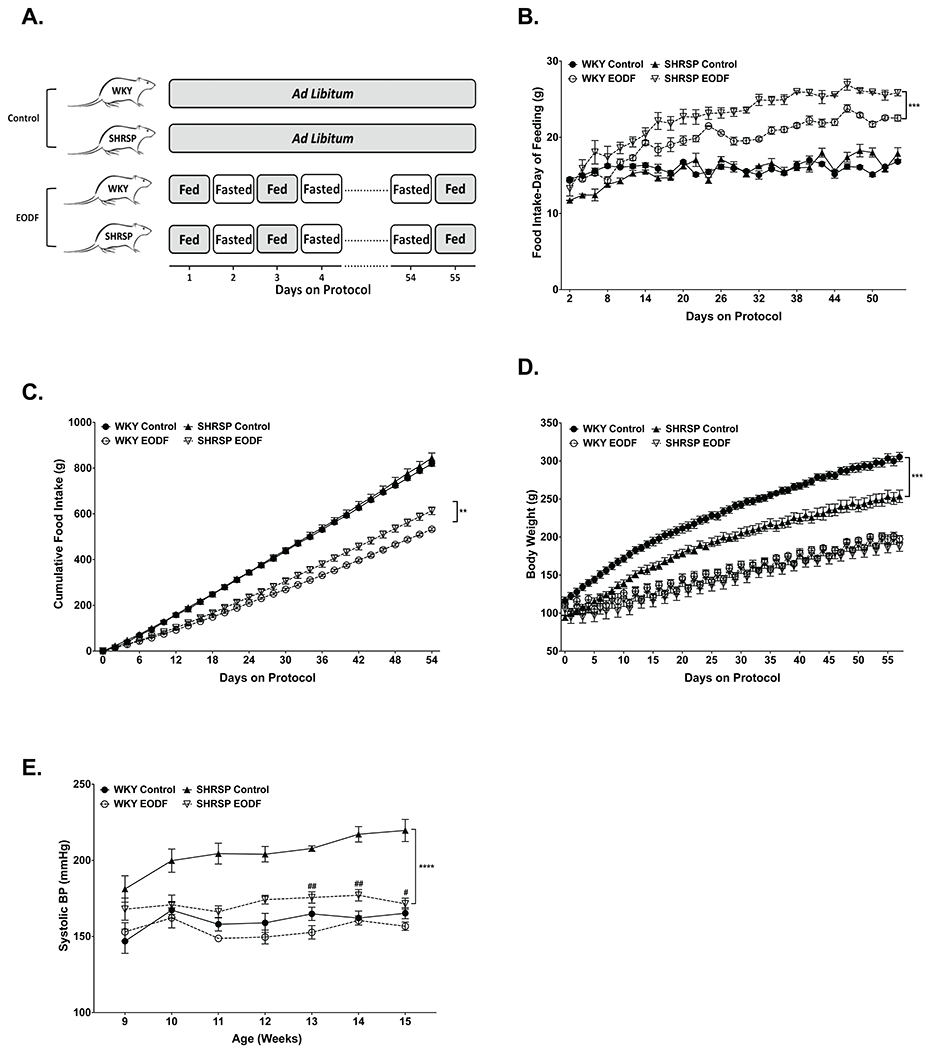
(a) Diagram depicting feeding schedule for control and EODF groups. (b)Daily and (c) cumulative food intake. (d) Body weights were measured daily over the course of the study. (e) Weekly SBP of WKY and SHRSP fed ad libitum or EODF. Data presented as mean ± SEM. Three-way ANOVA with Tukey’s multiple comparisons test. Main effects of strain, feeding group, age, age x strain, age x diet, age x strain x feeding group p≤0.05 for all (b-d). n=6-8, **p≤0.01, ***p≤0.0005, ****p≤0.0001, #p≤0.05 vs SHRSP Control, ##p≤0.005 vs SHRSP Control