
Figure. 3. The dysbiotic gut microbiota of SHRSP is altered by EODF.
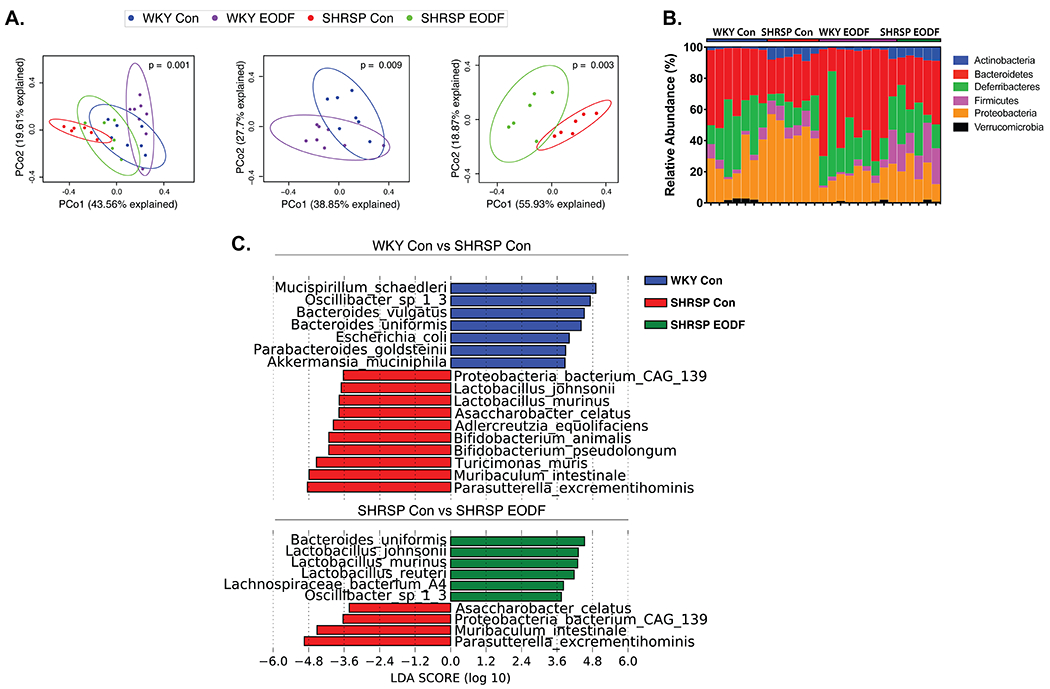
(a) Principal Coordinate Analysis plots of Bray-Curtis dissimilarity of four groups (left), WKY (middle), and SHRSP (right). (b) Relative abundance of taxa at phyla level for individual samples. (c) LEfSe plots to identify species that characterize control groups (top) and effects of EODF on SHRSP (bottom). n=6-8