
Figure. 4. Multi-omics integration of WGS and untargeted metabolomics.
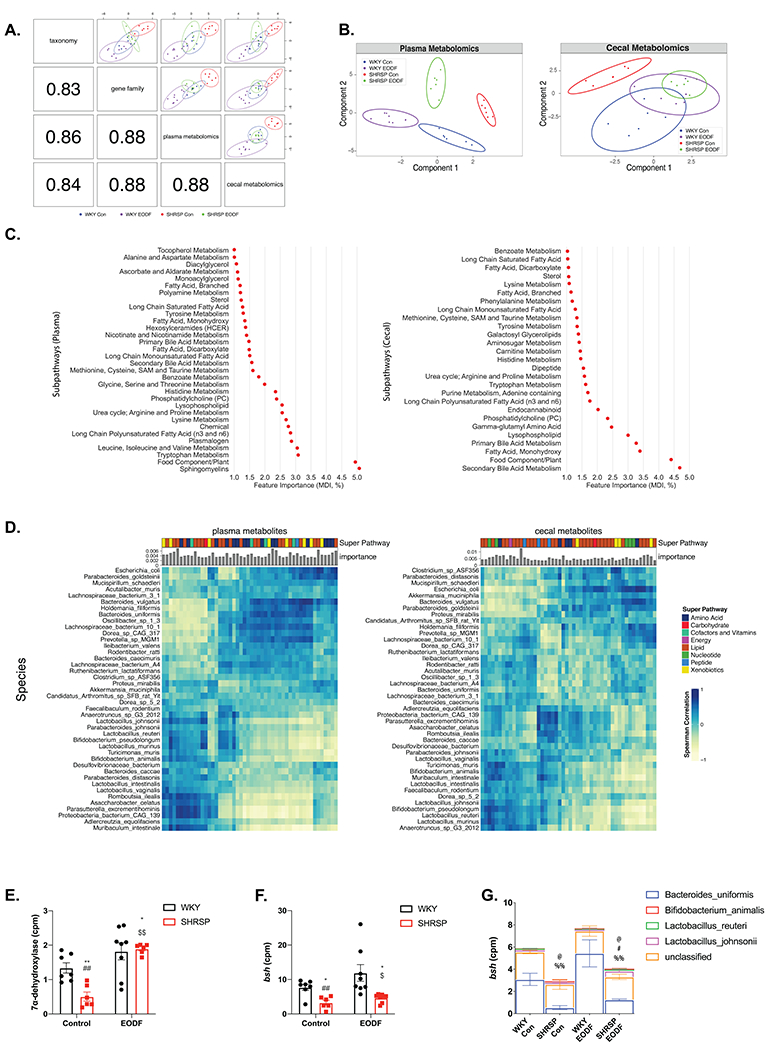
(a) Pearson correlation between component one of each dataset (bottom-left) and Sparse partial least squares discriminant analysis (sPLS-DA) of two omics (top-right). (b) Sparse partial least squares discriminant analysis (sPLS-DA) of plasma (left) and cecal (right) metabolites in four groups. (c) Plasma (left) and cecal (right) metabolite sub pathways identified by random forest classification as important for four group separation (Gini index as feature importance). (d) Spearman correlation between the top 50 most important metabolites (left:plasma, right:cecal) and species. Bar graphs indicate metabolite importance, and color blocks indicate super pathways. Comparison of total counts per millions of (e) 7α-dehydroxylase and (f) bile salt hydrolase (bsh). (g) Species stratified counts per million (cpm) of bsh gene. Two-way ANOVA with robust estimator followed by Mann-Whitney U test with Benjamin-Hochberg post hoc correction. Main effects of treatment p<0.0001. and interaction p= 0.0267 for (e). Main effects of genotype p=0.0267 for (f). Main effect of genotype for B.uniformis p=0.0083. Main effect of interaction for L.reuteri p=0.0345. Main effect of genotype p=0.0134 and interaction p=0.0334 for L.johnsonii. n=6-8. * p<0.05 vs WKY Con; ** p<0.01 vs WKY Con; ## p<0.01 vs WKY EODF; $ p<0.05 vs SHRSP Con; $$ p<0.01 vs SHRSP Con; @ p<0.05 vs WKY Con (B.uniformis); # p<0.05 vs SHRSP Con (B.uniformis); %% p<0.01 vs WKY EODF (B.uniformis)