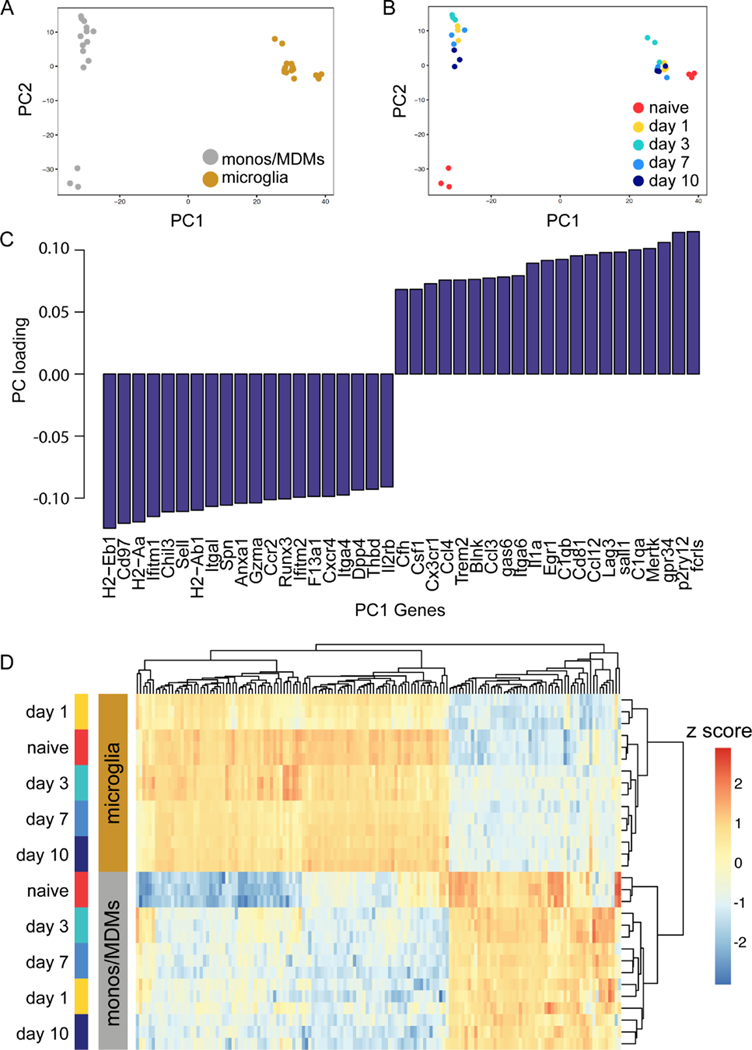
Figure 3. Microglia and MDMs are transcriptionally distinct cell populations in ICH.
A-B, PCA plot of ICH microglia and MDMs transcriptome. Each replicate represents pooled samples from three brains collected from mice 1, 3, 7, and 10 days after ICH surgery or the naïve animals. The scatter plots show each sample projected on the first 2 principal components and are color coded according to cell type (A) and time point (B) of each sample. Replicates cluster closely at each cell type. C, Bar plot of the top 20 genes contributing to separation along PC1, the major PC separating microglia and MDMs. D, Heatmap of the Z score of the 469 genes above level of detection across both microglia and MDMs data set. Data were clustered hierarchically in GENE-E using pairwise comparisons at each time point. Data are colored according to row minimum and maximum.

