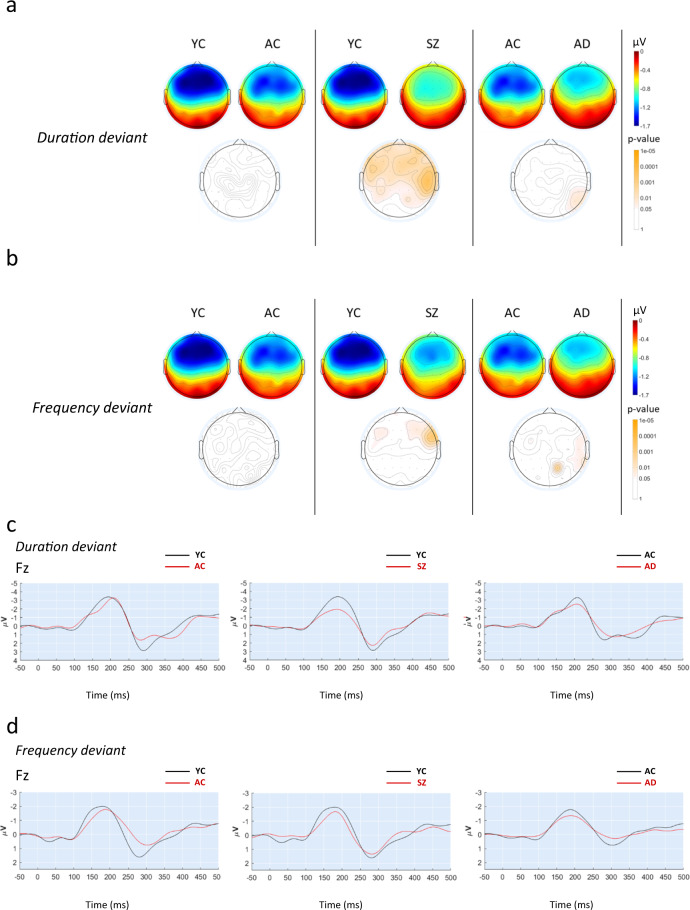
Fig. 2. MMN response in healthy controls, SZ, and AD patients.
Brain topographic maps for all electrodes showing MMN average amplitude during the auditory oddball paradigm (50-ms standard tones of 1000 kHz, 100-ms duration-deviant tones of 1000 kHz, and 50-ms frequency-deviant tones of 1050 Hz) in young controls (YC), aged controls (AC), Schizophrenia patients (SZ), and Alzheimer’s disease patients (AD) for duration deviants (a) and frequency deviants (b). Below each pannel, the corresponding p-values are shown as brain heatmaps and obtained for the indicated comparisons using a two-sample two-tail Student’s t test. The results are expressed as means. (c) Grand average-evoked potentials elicited during the auditory oddball stimulation and illustrating MMN average amplitude at the Fz electrode for duration and frequency deviants (d) in young control (YC), aged control (AC), schizophrenic patients (SZ), and Alzheimer’s patients (AD). The results are expressed as mean and negativity is plotted as an upward deflection.

