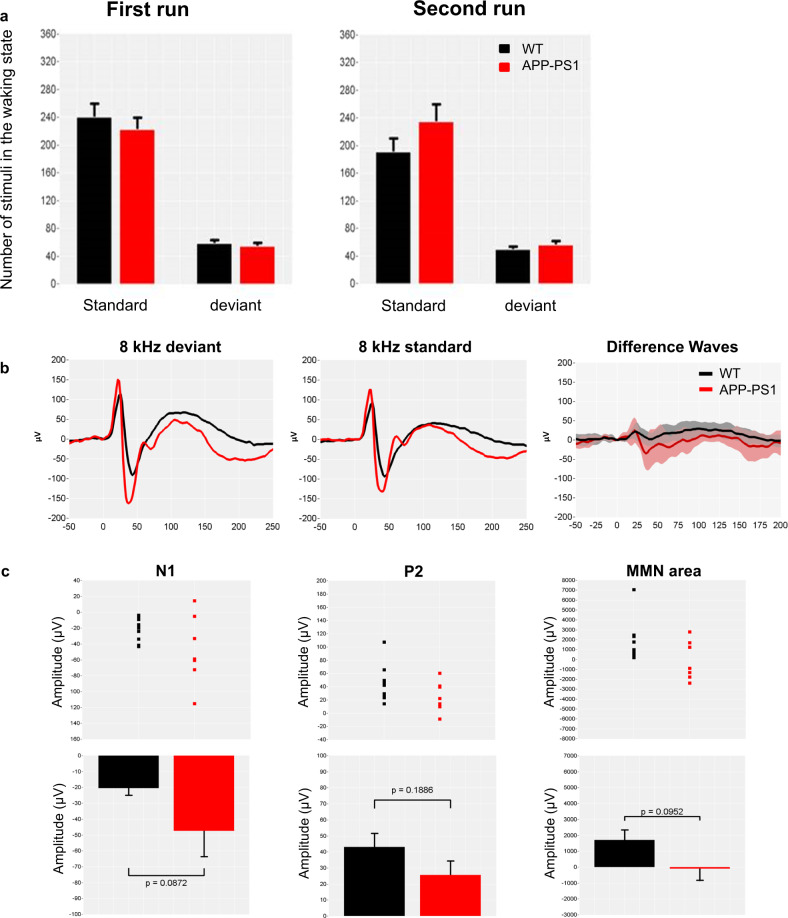
Fig. 4. MMN response in APP/PS1 mice.
Grand average-evoked potentials elicited during auditory passive oddball stimulation flip-flop protocol in 13-month-old APP/PS1 and wild-type (WT) mice. a Number of trials categorized as wakefulness for both runs are shown, whereas the remaining AEP responses were discarded from the final analysis. b Changes on standards and deviants’ stimuli (standard tones of 8 kHz presented at 80% probability; deviant tones of 8 kHz presented at 20% probability) in both genotypes; top-left and middle plots, on difference N1 and P2 waveforms at 20–60 ms and 100–150 ms after stimulus presentation, respectively; top right, on the MMN area at 50–125 ms post stimuli presentation. Average-evoked auditory responses had similar waveforms during the waking state. c Scatterplots of the individual N1 and P1 responses and for the AUC of the N1 differential responses (middle plots). Bar charts showing the mean amplitude values for N1 and P1 responses and for the AUC of the N1 differential responses (bottom plots). Data from three APP/PS1 mice were excluded from the group analysis: in one animal, one electrode was defected and produced artifacts, whereas AEP components were not detectable in two animals. Mean amplitude data are presented as mean + SEM.

