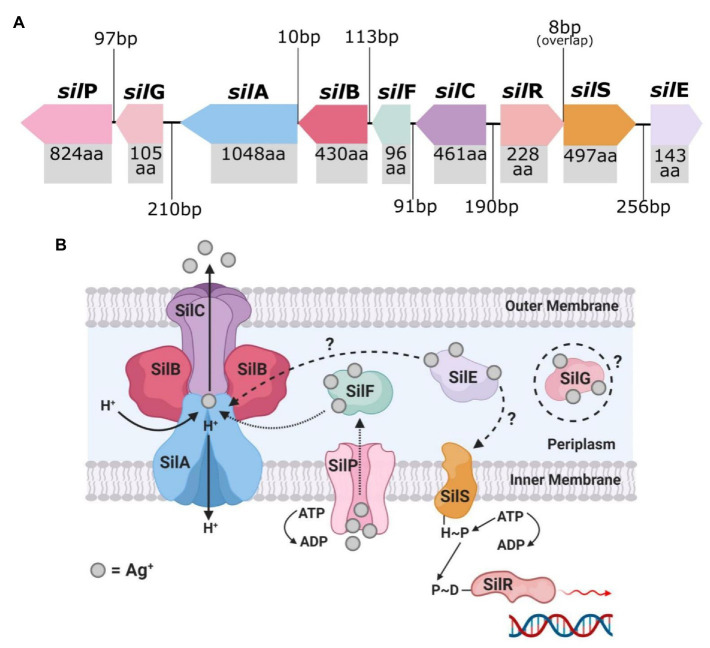
Figure 3.
The top image (A) shows the genetic arrangement of the sil operon and includes the intergenic DNA base pair (bp) gaps/overlaps and each sil gene’s protein product amino acid (aa) length. The bottom image (B) is a graphical representation of the known and predicted protein arrangement and functions of the encoded membrane bound Sil efflux system. Created in Inkscape (A) and BioRender (B). Adapted from Randall et al. (2015).

