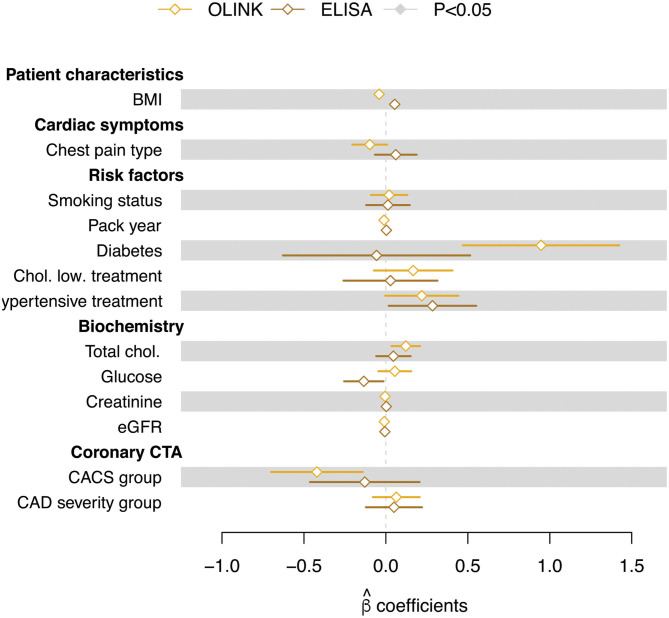
Figure 4.
Regression coefficients (β estimates) from multiple linear regression of circulating sortilin (adjusted values) measured with OLINK and ELISA technologies. Error bars indicate the standard error on the estimate. Filled symbols indicate that the β estimates are significantly different from zero.

