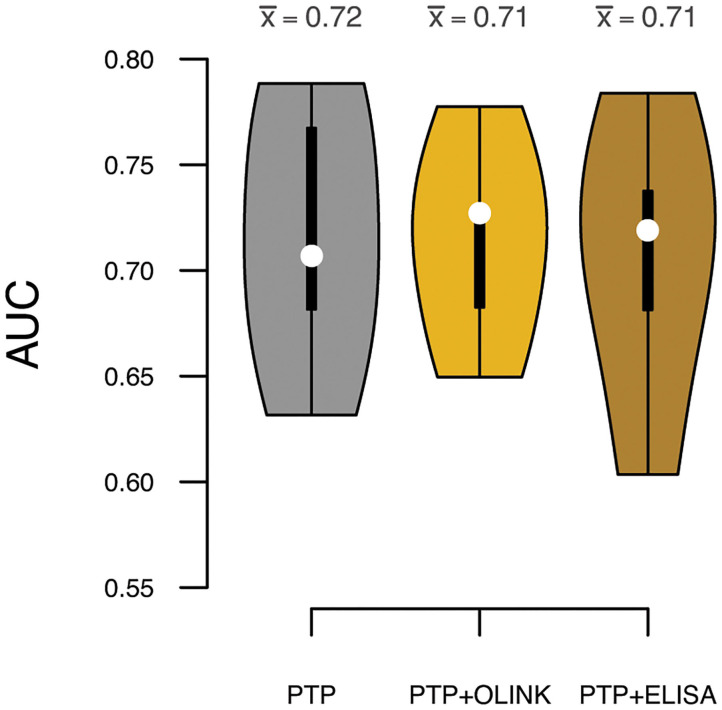
Figure 6.
Prediction accuracies measured by area under the receiver operating characteristic curve (AUC) for discrimination of obstructive CAD. White dots indicate median AUC across the five validation sets, and the mean AUC () for each model is indicated above each violin. Predictions were based on the pretest probability (PTP) with and without sortilin measurements by OLINK and ELISA.

