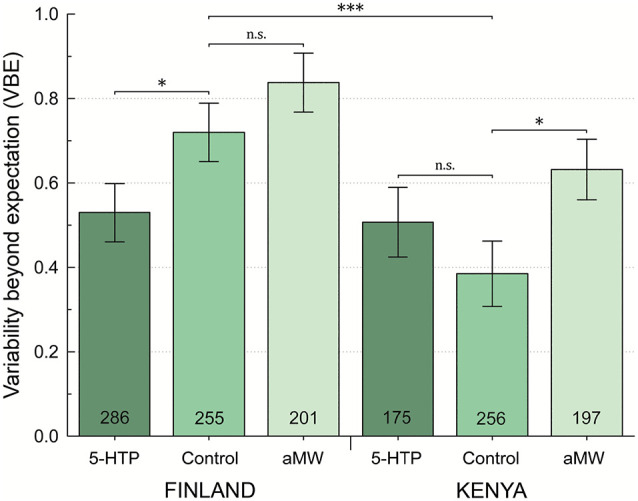
Figure 2.

Behavioral variability beyond statistical expectation (VBE) by site and pharmacological treatment. On a log2 scale, VBE = 0 indicates no excess variability, and VBE = 1 indicates twice as much variability as would be expected by chance alone. Error bars are ±1 SE, calculated by bootstrap resampling; n.s.P > 0.05, *P < 0.05, ***P < 0.001 represent one-tailed significance.
