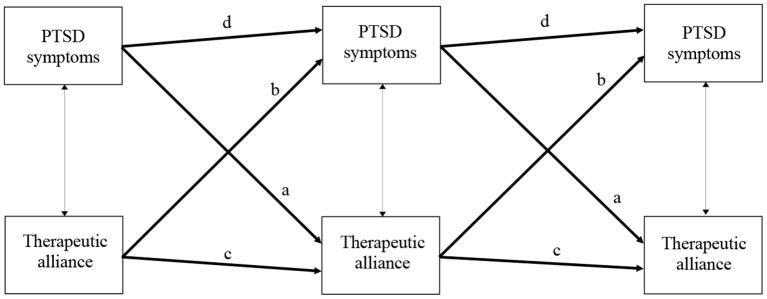
Figure 1.
Schematic figure of the hypothesized autoregressive, cross-lagged models. Thick paths with arrows in one direction, such as a (PDSt → WAIt+1; t refers to the respective treatment session and t+1 to 2 sessions later) and b (WAIt → PDSt+1) indicate cross-lagged effects, paths c (WAIt → WAIt+1) and d (PDSt → PDSt+1), indicate autoregressive effects; thin paths with arrows in both directions represent correlations at the same session (PDSt ↔ WAIt).

