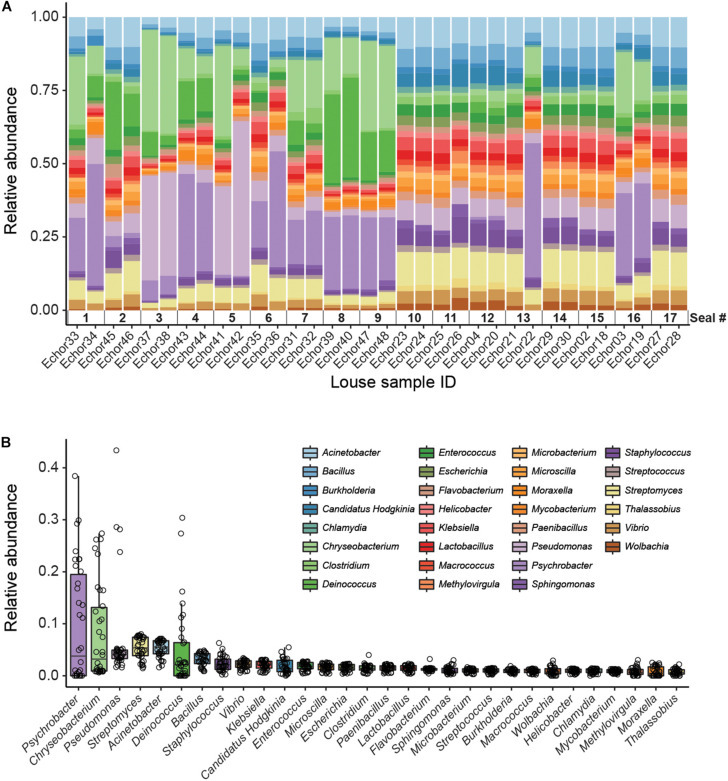
FIGURE 2.
Kaiju data (genus level). (A) Stacked bar plot showing bacterial relative abundances in each seal louse sample. Note that samples are sorted according to host individual (i.e., samples from the same host are next to each other). (B) Boxplot summarizing the relative abundance of each taxon across all louse samples. Individual points (horizontally jittered) depict the relative abundance of each taxon in each sample.

