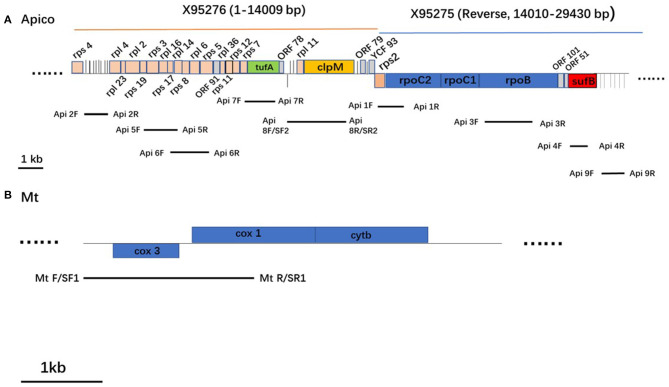
Figure 2.
Schematic representation of the apicoplast genome (A) and mitochondrion genome (B) in Plasmodium falciparum. Protein coding genes are boxed and color-coded. tRNAs are represented by vertical lines. Genes shown above the horizontal line in each genome are transcribed left to right, and those below are transcribed from right to left.

