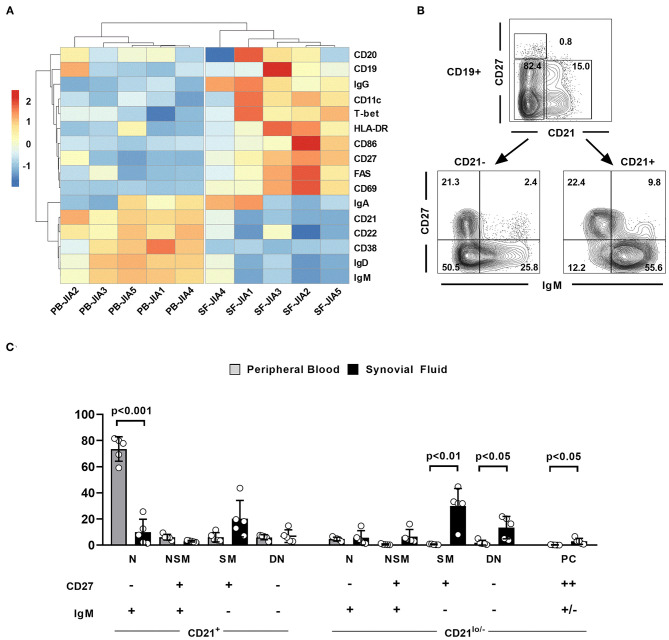
Figure 2.
The extended phenotype of synovial fluid B cells in JIA patients. (A) Hierarchical cluster analysis of mean fluorescence intensities of different markers in CD19+ peripheral blood (PB) and synovial fluid (SF) B cells from five JIA patients assessed by flow cytometry. (B) Flow cytometric gating strategy of different SF B cell populations. (C) Distribution of different B cell populations within CD19+ PB and SF B cells of five JIA patients. Groups were compared using paired Student's t-test. Bars represent mean frequency with standard deviation and circles individual data points. N, Naïve; NSM, non-switched memory; SM, switched memory, DN, double negative; PC, plasma cells.

