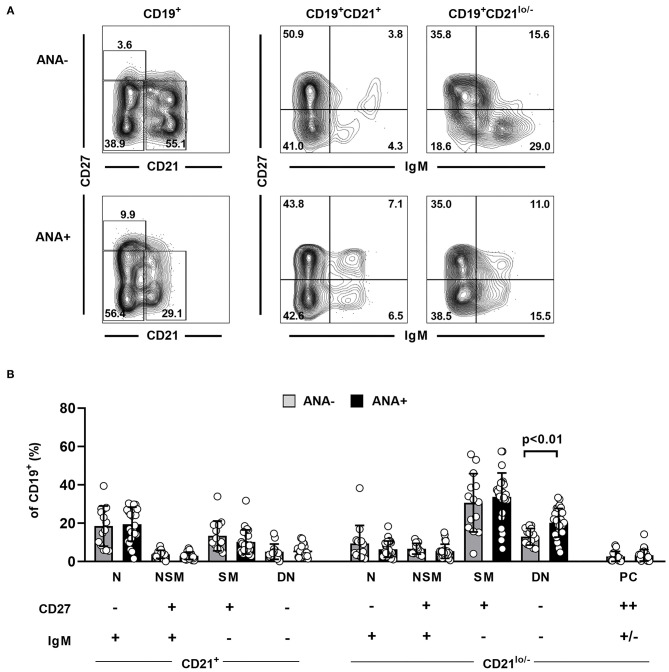
Figure 3.
Distribution of synovial fluid B cell populations in ANA positive and negative JIA patients. (A) Representative contour plots showing the distribution of different B cell subpopulations as assessed by expression of CD21, CD27, and IgM in an ANA– and an ANA+ JIA patient. (B) Distribution of different B cell population within SF CD19+ B cell was analyzed using flow cytometry and compared between ANA– (n = 14) and ANA+ (n = 25) JIA patients (unpaired Student's t-test). Bars represent mean frequency with standard deviation and circles individual data points. N, naïve; NSM, non-switched memory; SM, switched memory, DN, double negative; PC, plasma cells.

