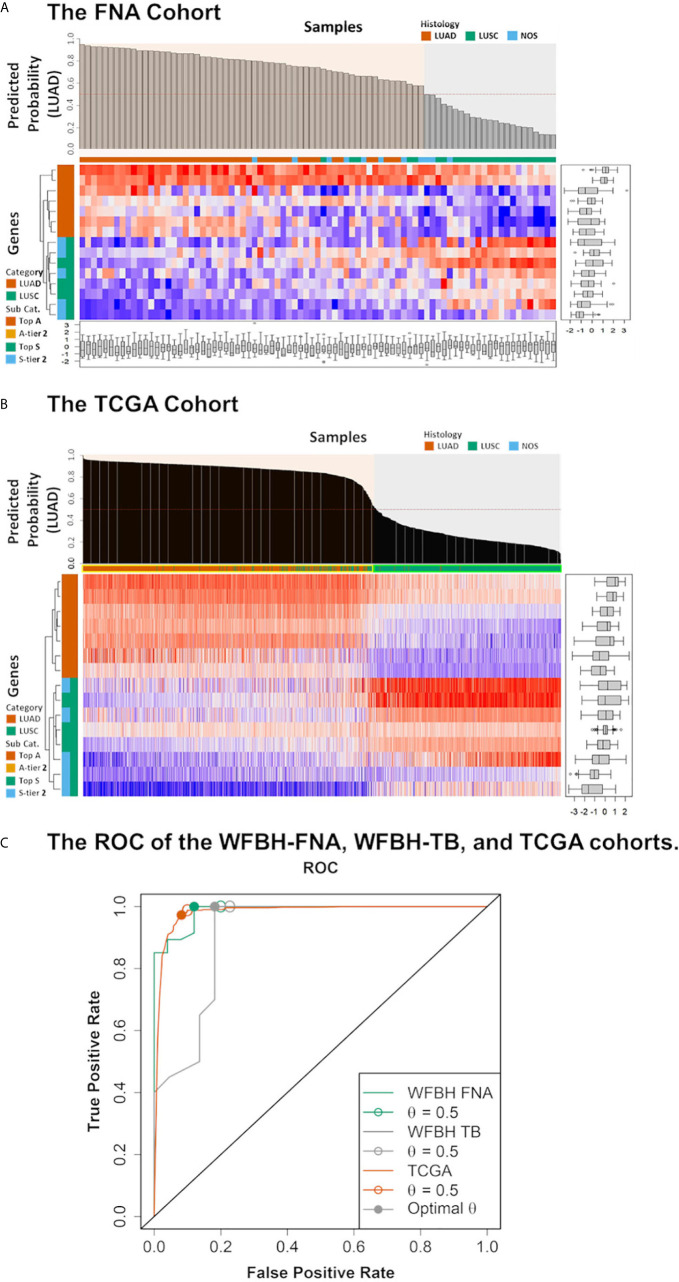
Figure 3.
Model performance. The predicted probabilities of subtype LUAD for (A) each FNA samples and (B) each TCGA samples was visualized in the bar plot. Samples classified as LUAD (p ≥ 0.5) or LUSC (p < 0.5). Signature genes used in the molecular subtyping model were listed according to the absolute values of their logistic regression coefficients. The categories of the genes were color coded with respect to the associated subtypes (vermilion for LUAD and bluish green for LUSC). (C) The receiver operating characteristic curves (ROCs) of the model performance on the WFBH FNA, the WFBH tissue bank, and the TCGA cohorts. The corresponding c-statistics (AUC, area under the ROC curve) were 0.986, 0.911, and 0.982, respectively. When the probability threshold is set at θ = 0.5, model accuracies are 0.931, 0.881, and 0.945 for the WFBH FNA, the WFBH tissue bank, and the TCGA cohorts, respectively (marked as open circles). The optimal accuracies are reached when optimal θ levels are used, which are: 0.958 at θ = 0.60 for the WFBH FNA cohort, 0.905 at θ = 0.59 for the WFBH tissue bank cohort, and 0.946 at θ = 0.68 for the TCGA cohort (solid gray circles).

