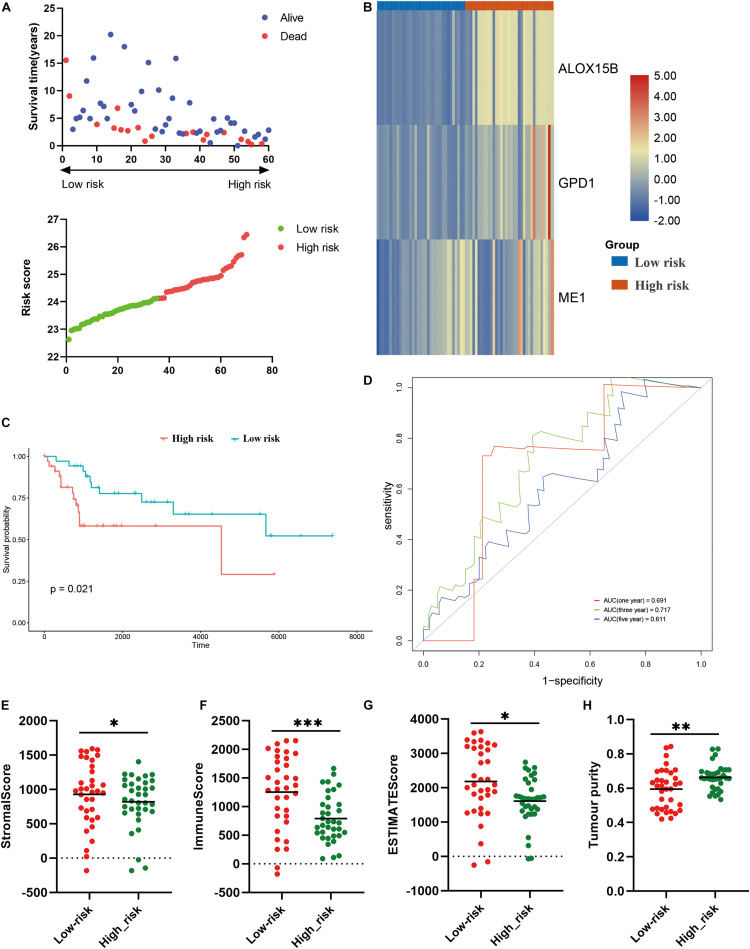
FIGURE 7.
Validation of the constructed risk model in the verification cohort. (A) distribution of survival status and risk score, (B) heatmap illustrating the expression of three candidate genes in the verification cohort, (C) survival curve of the patients in the high and low risk groups in the verification cohort, (D) ROC curve of the risk model in the verification cohort, (E–H) stromal score, immune score, ESTIMATE score and tumor purity calculated by ESTIMATE algorithm. *p < 0.05; **p < 0.01; ***p < 0.001.

