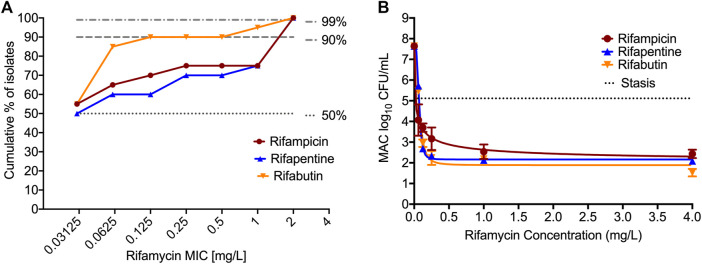
FIGURE 1.
MIC distribution and concentration-response of rifamycins against MIC. (A). MIC distribution of 20 MAC clinical isolates against the three rifamycins. (B). Bacteria was exposed to different static concentrations of the drugs for seven days. The solid line is for model fit, and symbols represent the data point. The kill below stasis [day 0 or inoculum] with rifampin was 2.68 (95% Confidence Interval (CI): 1.13 to 4.24) log10 CFU/mL, for rifapentine was 3.03 (95% CI: 2.89 to 3.17) log10 CFU/mL, and for rifabutin was 3.59 (95% CI: 2.22 to 4.96) log10 CFU/mL, respectively.

