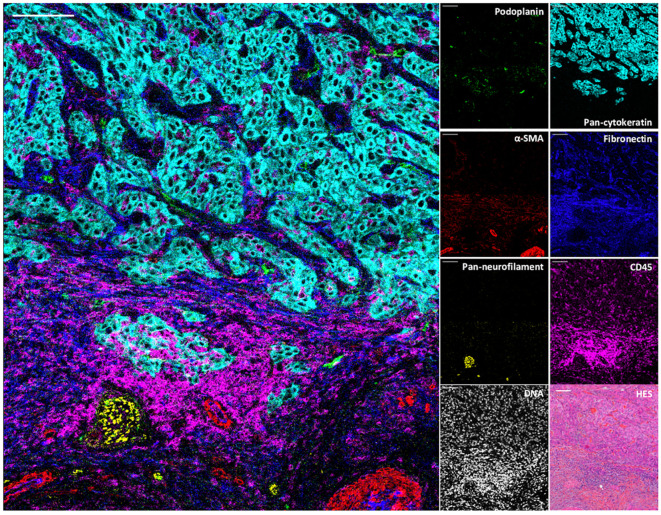
Figure 3.
Visualization by IMC of structural and cellular TiME components in a single region of cSCC section. Overlaid and single antibody signals representing lymphatic vessels (podoplanin), blood vessels and CAFs (aSMA), nerve fibers (pan-neurofilament), tumor cells (pan-cytokeratin), ECM (fibronectin) and immune cells (CD45) compared to nuclei and HES staining of the same region of cSCC-1 section. Scale bar = 100 μm.

