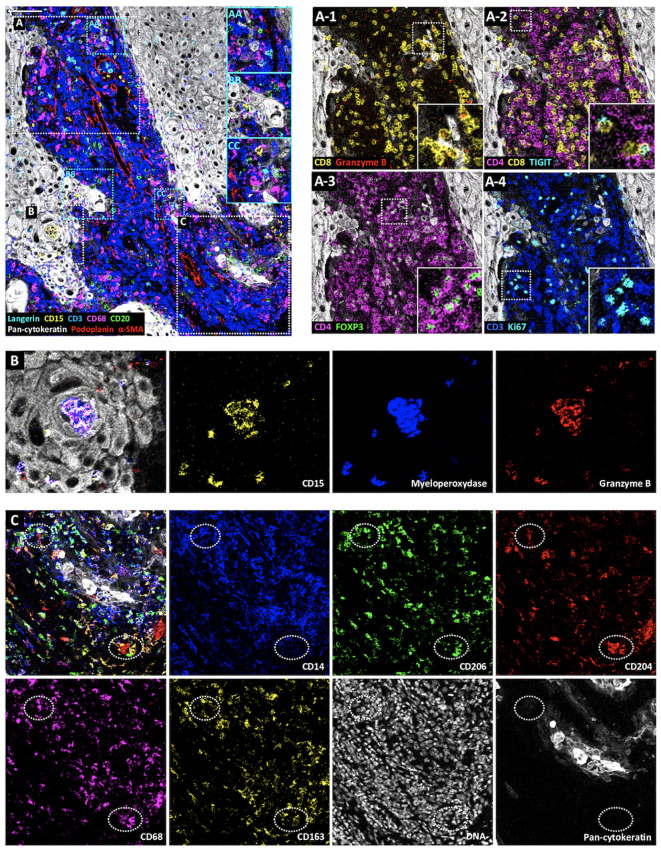
Figure 5.
Visualization by IMC of immune cell diversity in a single region of cSCC section. Representative cSCC region, from cSCC-3 section, showing the detection of Langerhans cells (Langerin), neutrophils (CD15), T cells (CD3), macrophages (CD68), B cells (CD20), tumor cells (pan-cytokeratin) and CAFs, blood and lymphatic vessels (α-SMA and podoplanin). (AA–CC) Identification of immune cell colocalizations. (A) Identification of T cell subset distribution: cytotoxic T cells (CD8+Ganzyme B+) (A-1), TIGIT-expressing CD4+ and CD8+ T cells (A-2), regulatory T cells (CD4+FOXP3+) (A-3) and proliferating T cells (CD3+Ki67+) (A-4). (B) Overlaid and single antibody signals targeting CD15, myeloperoxidase, and granzyme B neutrophil markers within tumor islet (pan-cytokeratin). (C) Identification of macrophage subsets. Overlaid and single antibody signals targeting CD14, CD206, CD204, CD68, CD163 and pan-cytokeratin. Scale bar = 100 μm.

