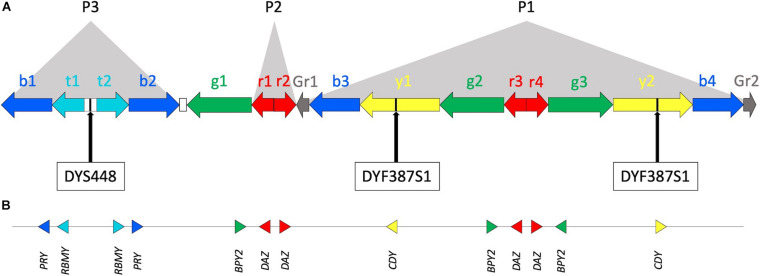
FIGURE 1.
The Y chromosome AZFc region. (A) Multiple copies of six amplicons are represented by color-coded arrows (b—blue, t—teal, g—green, r—red, y—yellow, and Gr—gray; adapted from Kuroda-Kawaguchi et al., 2001; Teitz et al., 2018, not in scale). Arrows direction indicates amplicon copy orientation. Most of the amplicons are arranged to form P1, P2, and P3 palindromes. The white rectangles between t1, t2, and b2, g1 represent the large P3 spacer and a single copy of Inverted Repeats 1 (IR1), respectively. Approximate positions of DYS448 and DYF387S1 short tandem repeats are shown. (B) Locations of protein coding genes within the AZFc. Triangle orientation refers to 5’–3’ polarity.

