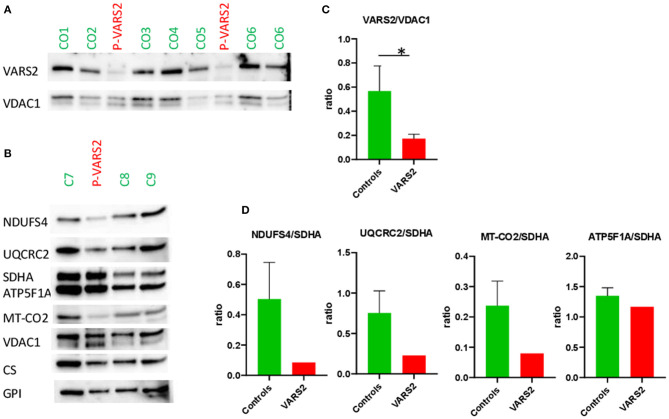
Figure 2.
(A,B) Western blot analysis of the muscle sample of the patient compared to healthy controls, using antibodies against VARS2, NADH dehydrogenase [ubiquinone] iron-sulfur protein 4 (NDUFS4), ubiquinol-cytochrome c reductase core protein 2 (UQCRC2), succinate dehydrogenase complex flavoprotein subunit A (SDHA), ATP synthase F1 subunit alpha (ATP5F1A), mitochondrially encoded cytochrome c oxidase II (MT-CO2), voltage-dependent anion-selective channel 1 (VDAC1, in outer mitochondrial membrane), citrate synthase (CS), glucosephosphate isomerase (GPI). (C,D) Bar graphs show the densitometry of the western blot bands. The intensity of the bands was determined using evaluation software (Imagelab, Biorad). The subunits of the OXPHOS complexes were evaluated in relation to VDAC1, CS, and GPI as loading controls. The results showed reduction of complex I in comparison to SDHA; moderate reduction of complex III and IV in comparison to SDHA and compensatory up-regulation/increase of complexes II and V. The ratios to VDAC1, CS, and GPI are shown in Supplementary Table 1. *p < 0.05.

