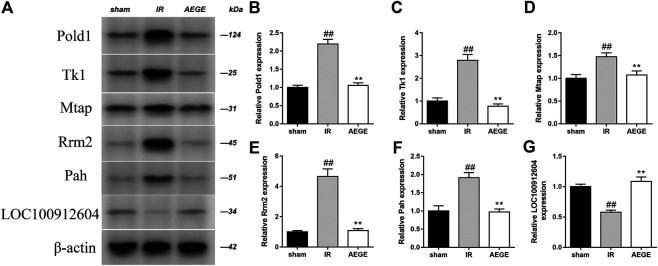
FIGURE 5.
Determination of protein levels in brain tissue of rats in the sham, CIR, and AEGE groups. Expression of Pold1 (A,B), Tk1, (A, C), Mtap (A,D), Rrm2 (A,E), Pah (A,F), and LOC100912604 (A,G) on the indicated group were detected using western blotting. Results are expressed as mean ± SD for three individual experiments which, were performed in triplicate for each condition. “#” represents sham group vs. the IR group (##p < 0.01); represents IR group vs. the AEGE group (**p < 0.01).

