Fig. 1.
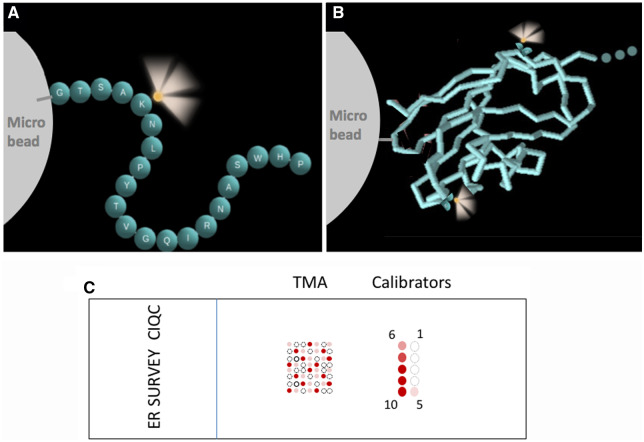
Schematic illustration of calibrator construction. The analyte is represented either by a peptide (A) or a protein (B), covalently coupled to a microbead. (A), Each sphere represents a single amino acid (single letter abbreviation) in a peptide. This particular sequence is for illustrative purposes only. Adapted from Vani et al. (3). (B), The recombinant extracellular domain of the PD-L1 protein is depicted using a stick model. In both peptide and protein, ≥1 fluorescein label (illustrated as glowing yellow spheres) provides a link for traceability of concentration. (C), Schematic illustration of the survey tool, showing the layout of calibrators and the TMA on a slide. The calibrators are organized in 2 columns with levels 1–5 on the right side and 6–10 on the left. Level 1 has the lowest biomarker (ER) concentration; level 10 has the highest. The TMA in (C) is for illustrative purposes; the exact number of tissue cores and the locations of positive and negative cores in the survey slide are different.

