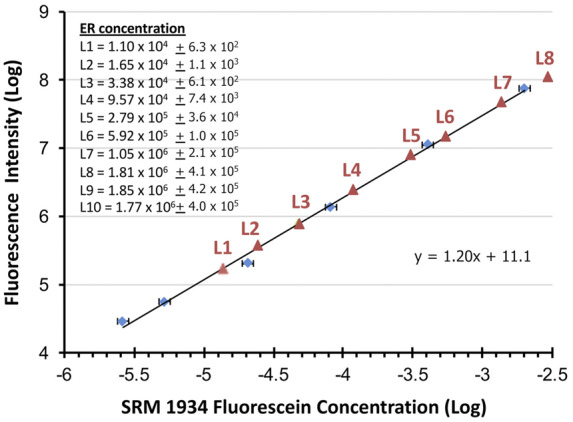
Fig. 2.

Method for establishing traceability of calibrator microbeads to NIST SRM 1934. The ER concentrations per microbead for each calibrator (list at upper left) are in units of ERFs. The blue diamonds are the data points from graphing fluorescence intensity (y axis) as a function of reference fluorophore concentration in micromoles per liter (x axis) using serial dilutions of the SRM 1934. A linear regression line and its equation from these data points is shown. The red triangles are the fluorescence intensity of each calibrator microbead suspension as each intercepts the linear regression line. Each is interpolated onto the x axis to find the equivalent concentration for the calibrator at each level (L).
