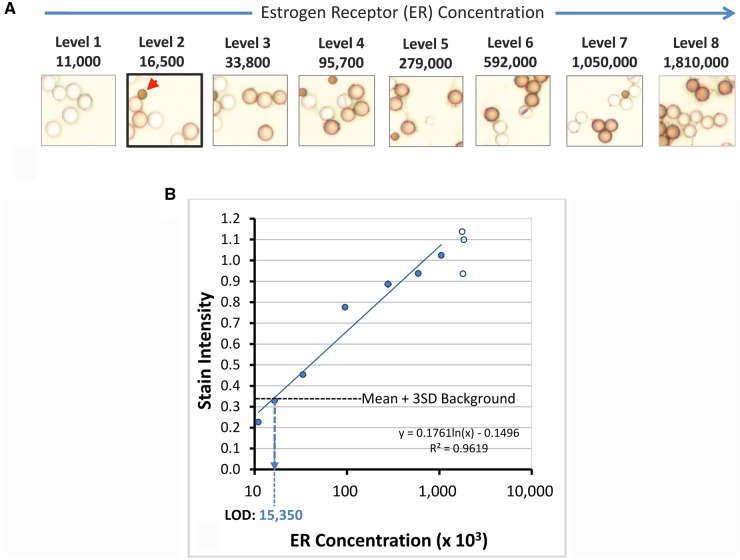
Fig. 3.
Derivation of lower LOD using calibrators. (A), Stained ER calibrators. The ER peptide-coated microbeads have concentrations ranging from 11 000 (level 1) to 1 810 000 (level 8) molecules per microbead. The concentrations are listed above each photomicrograph and are the same as shown at the upper left of Fig. 2. Visually, the LOD is at level 2 (accentuated with thick border). The red arrowhead identifies a smaller optical reference microbead, used for image quantification. These optical reference microbeads are permanently colored brown, regardless of staining. They provide an internal fixed optical reference point for image stain intensity measurement, normalizing for variations in microscopy. (B) Graphical representation of ER calibrator stain intensities (y axis) as a function of ER concentration (x axis). Each data point is the mean of duplicate measurements. The empty circles represent data from higher calibrator levels that are on the analytic response plateau and thus not included in the linear regression calculation. The horizontal dotted line represents the stain intensity of the background plus 3 SD. Background stain intensity is measured with an antigenically irrelevant calibrator. The calculated LOD in this example is 15 350 molecules per microbead.

