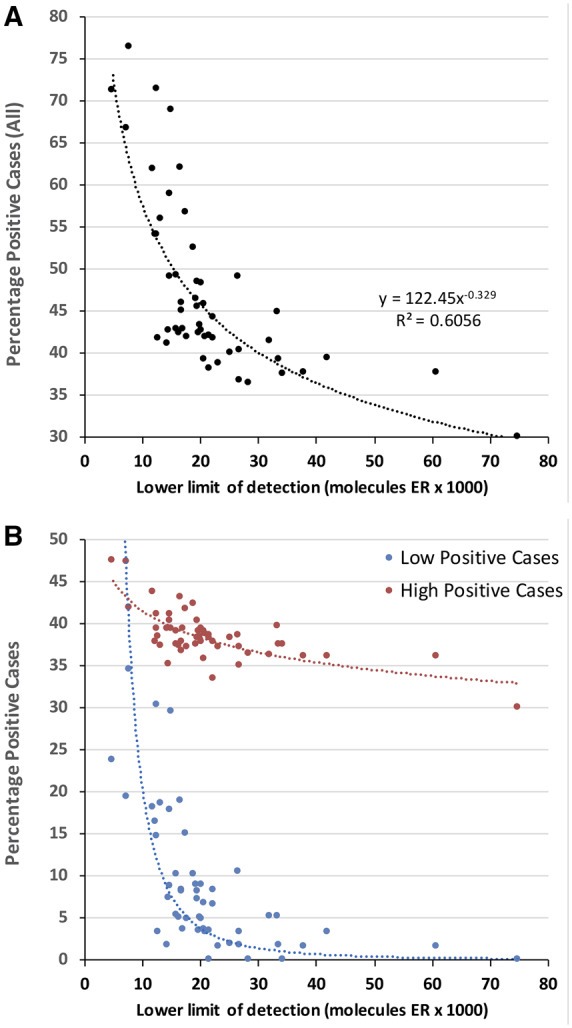
Fig. 5.

(A), Percentage of all positive cases as a function of analytic sensitivity (lower LOD). (B) Same data as in (A), but stratified by ER-high vs ER-low positive cases. In (B), the y axis is the percentage of cases that are classified as ER-low or ER-high, per the ASCO/CAP guidelines. The interlaboratory differences in analytic sensitivity principally affects the ability to detect ER-low positive breast carcinomas.
