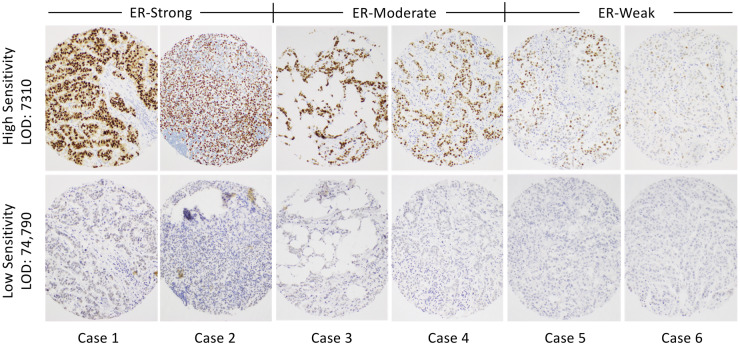
Fig. 6.
IHC staining of 6 breast carcinomas illustrating the range of stain intensities for the most sensitive (upper row) and least sensitive (lower row) laboratories. Included are cases that appear to have comparatively strong staining (cases 1 and 2), moderate staining (cases 3 and 4), and weak staining (cases 5 and 6) for ER.

