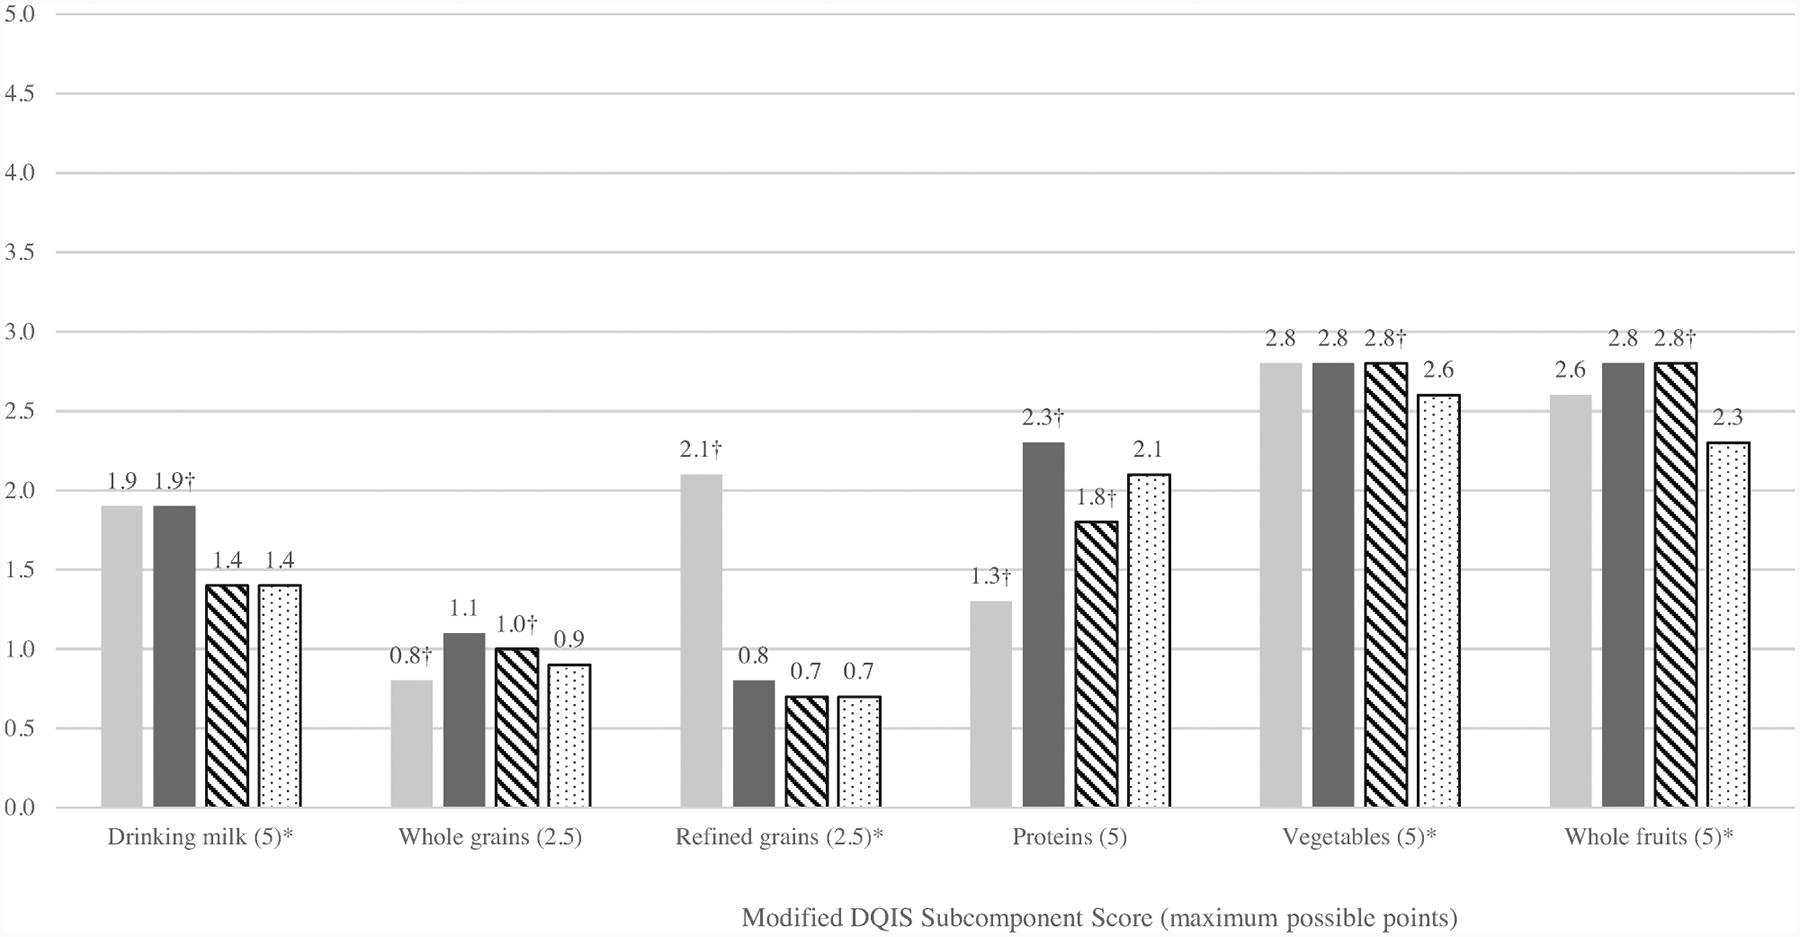
FIGURE 1.

Mean modified DQIS subcomponent scores among US children aged 6 mo–4 y on a given day by age, NHANES 2011–2016. The score for drinking milk includes several subcomponents: breast milk (children 6–11 mo only), infant formula, and cow milk/other milks. Higher subcomponent scores indicate higher age-appropriate intakes. See Table 1 or Supplemental Table 1 for additional information on scoring criteria. *P values for trend are calculated using linear regression, P < 0.02. †P values < 0.05 for difference between footnoted age group and the next successive age group using linear contrasts (6- to 11-mo-olds compared with 1-y-olds, 1-y-olds compared with 2- to 3-y-olds, 2- to 3-y-olds compared with 4-y-olds). Gray bars, 6- to 11-mo-olds (n = 495); black bars, 1-y-olds (n = 590); striped bars, 2- to 3-y-olds (n = 1128); dotted bars, 4-y-olds (n = 462). DQIS, Diet Quality Index Score.
