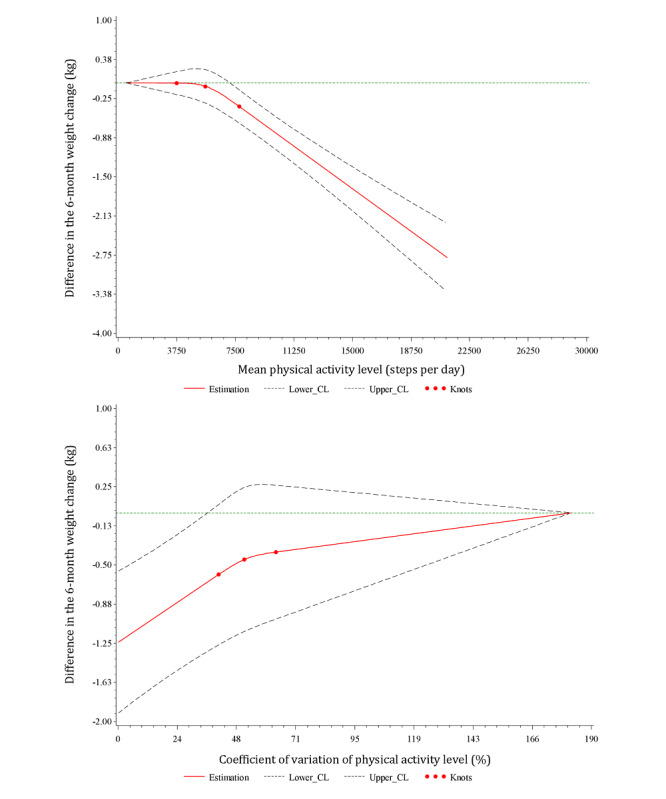
Figure 3.

Relationships between mean physical activity level and the variability in physical activity level and 6-month weight change fitted with restricted cubic splines (3 knots placed at the 25th, 50th, and 75th percentiles). The solid red line represents the mean differences; the dashed lines are the 95% confidence limits; the green straight horizontal line corresponds to the line, y=0. The y-axis represents the difference in the 6-month weight change between individuals with any value of mean physical activity level (top) or physical activity level coefficient of variation (bottom) with individuals with the minimum value of mean physical activity level (516 steps/day; top) or with the maximum value of physical activity level coefficient of variation (182%; bottom). CL: confidence limit.
