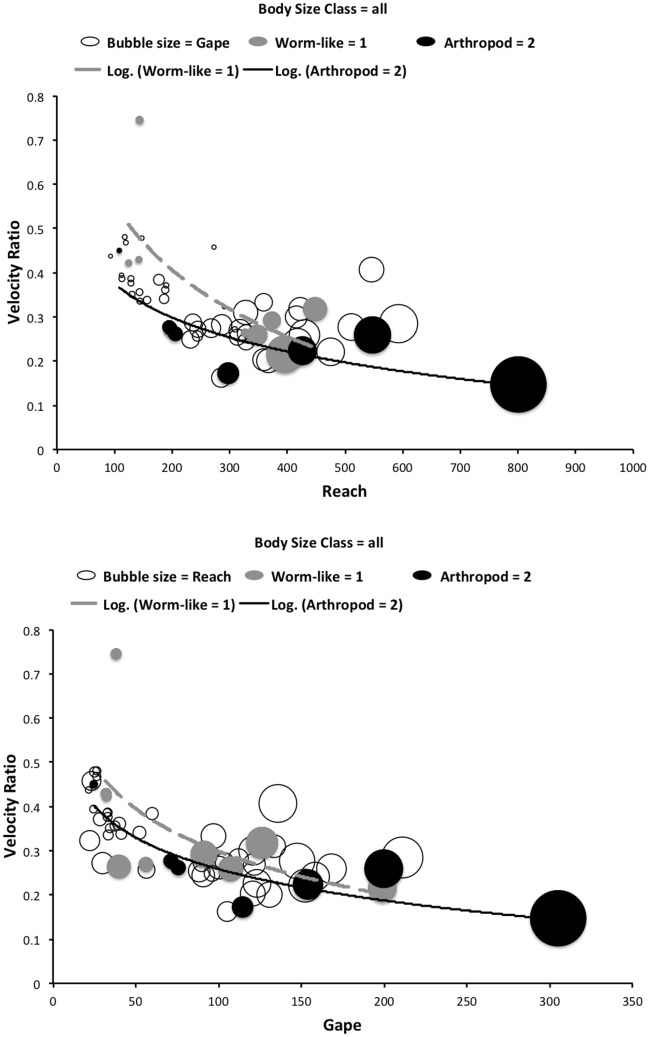
Fig. 10.
Paying attention to small organisms is illuminating. Plot of chelal velocity ratio () for mesostigmatids (this study + from Buryn and Brandl 1992) versus chelal gape (MDL) or cheliceral reach (CL). Log regression lines (simply for illustration) fitted to known feeding preferences (grey dashed = worm-like prey; black solid = microarthropod prey). Note lines join asymptotically at large mite sizes. Upper Against reach (CL) with gape (MDL) as bubble size. Lower Against gape (MDL) with reach (CL) as bubble size

